The Mauritian insurance market

Insurance market features
- Regulatory authority: Financial Services Commission
- Life and non life premiums (2011): 682 million USD
- Insurance density (2011): 524.6 USD
- Insurance penetration rate (2011): 5.68%
Market structure in 2011
Actors | Number |
|---|---|
Life companies | 11 |
Non life companies | 14 |
Country profile
- Area: 2 040 km2
- Population (2011): 1 300 000 inhabitants
- GDP (2011): 12 billion USD
- GDP per capita (2011): 9 231 USD
- GDP growth rate (2011): 3.8%
- Inflation rate (2011): 6.6%
- Main economic sectors: food industry (sugar), textile, tourism and services.
Main cities
(in number of inhabitants)
- Port Louis (capital): 155 000
- Quatre Bornes: 81 700
- Curepipe: 81 600
Evolution of life and non life premiums: 2007-2011
in thousands USD| 2007 | 2008 | 2009 | 2010 | 2011 | |
|---|---|---|---|---|---|
Non life | 141 793 | 158 733 | 179 101 | 189 871 | 222 073 |
Life | 281 226 | 304 730 | 325 337 | 407 460 | 460 491 |
Total | 423 019 | 463 463 | 504 438 | 597 331 | 682 564 |
Turnover’s evolution: 2007-2011
in thousands USD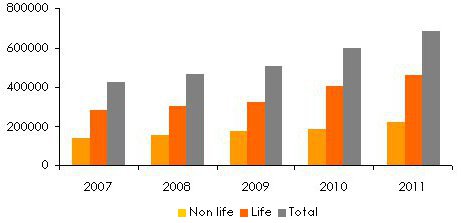
Turnover’s evolution per class of business: 2008-2011
in thousands USD| 2008 | 2009 | 2010 | 2011 | 2011 shares | |
|---|---|---|---|---|---|
| Non life | |||||
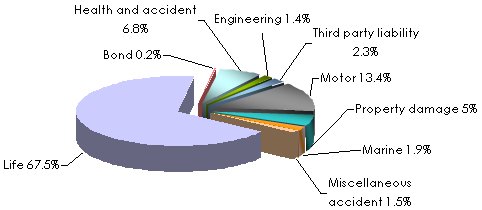
Health and accident | 26 004 | 32 265 | 36 522 | 46 239 | 6.8% |
Engineering | 8 314 | 9 924 | 10 667 | 9 526 | 1.4% |
Third party liability | 7 621 | 11 629 | 14 990 | 15 837 | 2.3% |
Motor | 63 501 | 73 560 | 77 754 | 91 570 | 13.4% |
Property damage | 29 219 | 31 014 | 29 132 | 34 103 | 5% |
Marine | 14 004 | 13 189 | 10 588 | 12 630 | 1.9% |
Miscellaneous accident | 9 870 | 7 274 | 9 458 | 10 508 | 1.5% |
Bond | 200 | 246 | 760 | 1 660 | 0.2% |
Total non life | 158 733 | 179 101 | 189 871 | 222 073 | 32.5% |
| Life | |||||
Total life | 304 730 | 325 337 | 407 460 | 460 491 | 67.5% |
Grand total | 463 463 | 504 438 | 597 331 | 682 564 | 100% |
Turnover’s breakdown per class of business in 2011
Turnover per class of business and per non life company in 2011
in thousands USD| Health & accident | TPL | Misc. accident1 | Motor | Property damage2 | Marine | Total | 2011 shares | |
|---|---|---|---|---|---|---|---|---|
Mauritius Union | 11 693 | 4 664 | 2 018 | 25 895 | 8 202 | 1 566 | 54 038 | 24.3% |
Swan | 18 584 | 1 346 | 3 370 | 9 136 | 12 479 | 2 706 | 47 621 | 21.4% |
Cim Insurance | 5 147 | 4 795 | 3 544 | 4 481 | 5 636 | 1 310 | 24 914 | 11.2% |
Mauritian Eagle | 3 922 | 1 201 | 366 | 6 220 | 8 020 | 3 596 | 23 325 | 10.5% |
State Insurance Co. | 2 225 | 3 315 | 298 | 8 812 | 3 887 | 3 186 | 21 723 | 9.8% |
New India | 34 | 47 | 1 519 | 8 906 | 2 868 | 70 | 13 444 | 6.1% |
Phoenix | 28 | 27 | 54 | 7 601 | 338 | 8 | 8 056 | 3.6% |
Sun Insurance | 69 | 136 | 35 | 5 888 | 1 362 | 66 | 7 556 | 3.4% |
Lamco Insurance | 5 | 21 | 82 | 5 878 | 179 | 35 | 6 200 | 2.8% |
GFA Insurance | 29 | 59 | 55 | 4 906 | 91 | 9 | 5 149 | 2.3% |
British American | 4 321 | - | - | - | - | - | 4 321 | 2.0% |
Jubilee | 155 | 200 | 125 | 1938 | 468 | 62 | 2 948 | 1.3% |
Indian Ocean Gen. | 27 | 26 | 64 | 1 909 | 98 | 16 | 2 140 | 1% |
Credit Guarantee | - | - | 638 | - | - | - | 638 | 0.3% |
Total | 46 239 | 15 837 | 12 168 | 91 570 | 43 629 | 12 630 | 222 073 | 100% |
Market shares of the first five non life companies in 2011
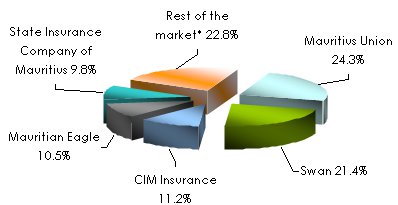 * 9 companies
 Turnover of life companies in 2011
in thousands USD| 2011 turnover | 2011 shares | |
|---|---|---|
British American Insurance | 233 039 | 50.6% |
Sicom | 95 773 | 20.8% |
Anglo Mauritius | 78 783 | 17.1% |
La Prudence Mauricienne | 22 096 | 4.8% |
Life Insurance Corporation of India | 11 307 | 2.4% |
Cim Life | 10 825 | 2.3% |
Island Life | 5 300 | 1.2% |
Mauritian Eagle Life | 2 146 | 0.5% |
Phoenix | 717 | 0.2% |
Lamco | 281 | 0.1% |
Indian Ocean General Assurance | 224 | 0.0% |
Total | 460 491 | 100% |
Market shares of the first five life companies in 2011
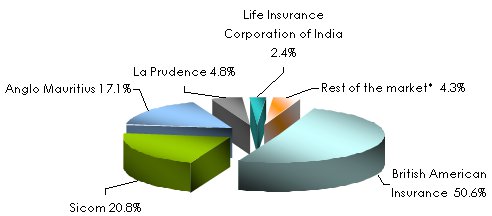 * 6 companies
 Main non life technical highlights: 2007-2011
in thousands USD| 2007 | 2008 | 2009 | 2010 | 2011 | |
|---|---|---|---|---|---|
Gross written premiums | 141 793 | 158 733 | 179 101 | 189 871 | 222 073 |
Net written premiums | 76 481 | 91 727 | 107 577 | 114 737 | 139 640 |
Net earned premiums | 72 879 | 84 798 | 101 004 | 109 052 | 129 850 |
Net incurred losses | 52 424 | 59 893 | 64 060 | 73 241 | 77 165 |
Management expenses | 37 229 | 39 285 | 45 556 | 50 656 | 53 699 |
- Commissions | 11 977 | 12 548 | 15 828 | 16 665 | 18 358 |
- Overhead expenses | 25 252 | 26 737 | 29 728 | 33 991 | 35 341 |
Loss ratio | 71.9% | 70.6% | 63.4% | 67.2% | 59.4% |
Expenses ratio | 26.3% | 24.7% | 25.4% | 26.7% | 24.2% |
Combined ratio | 98.2% | 95.3% | 88.8% | 93.9% | 83.6% |
Earned premiums, incurred losses and loss ratios per non life insurance in 2011
in thousands USD| Net earned premiums | Net incurred losses | Loss ratio | |
|---|---|---|---|
Health and accident | 24 052 | 21 423 | 89.1% |
Engineering | 1 636 | 501 | 30.6% |
Third party liability | 5 225 | 1 360 | 26% |
Motor | 82 358 | 47 389 | 57.5% |
Property damage | 8 127 | 4 031 | 49.6% |
Marine | 5 219 | 1 571 | 30.1% |
Miscellaneous accident | 2 670 | 861 | 32.2% |
Bond | 563 | 29 | 5.1% |
Total | 129 850 | 77 165 | 59.4% |
Exchange rate MUR/USD as at 31/12 | 2007 | 2008 | 2009 | 2010 | 2011 |
0.03632 | 0.03352 | 0.03421 | 0.03406 | 0.03555 |