Al Buhaira National Insurance Company (ABNIC)

Detained at 63% by local investors, the company has been listed in Abu Dhabi stock market since 2005. By December 31, 2015, ABNIC’s capital amounted to 68 million USD for a total of 167 million USD in shareholder's equity and 476 million USD in assets.
Ranked among the medium sized companies in an extremely competitive market, ABNIC recovered by the end of 2015 a level of performance that is similar to the one attained in 2011, a year regarded to be one of the most prosperous.
The 2015 turnover amounted to 168 million USD, a 10% Increase in comparison with 2014. The portfolio is made up of 85% of motor, accident and health risks. With the exception of the 105% peak in 2013, the combined ratio for the recent five years ranges between 85% and 90%. These results, achieved in a market renowned for its competitiveness, are regarded to be very encouraging.
Unlike numerous Emirati companies that are investing outside their boundaries, ABNIC is solely focused on the local market where it owns 17 branches and underwriting offices.
ABNIC in 2015
| Share capital | 68 085 000 USD |
| Turnover | 168 856 853 USD |
| Assets | 476 260 036 USD |
| Shareholder’s equity | 167 426 583 USD |
| Net result | 9 297 630 |
| Gross loss ratio | 75.7% |
| Gross expenses ratio | 7.5% |
| Gross commission ratio | 3.2% |
| Gross combined ratio | 86.4% |
| Network | 17 branches and offices in the United Arab Emirates |
| Number of employees | 310 |
Major shareholders
| Private Investment Group Ltd | 27.72% | |
| Sh. Abdullah M. Al Thani | 13.47% | |
| Sh. Faisal K. Al Qassimi | 12.34% | |
| Suha A. F. Al Nabulsi | 9.29% | |
| Others actionnaires | 37.18% |
Management
| Chairman | Faisal Bin Sultan Bin Salem Al Qassimi | |
| CEO | Khaled Bin Abdullah Bin Sul Al Qassimi | |
| General Manager | Nader Tawfeeq Qaddumi | |
| Chief Accountant | Mohammed Dawood | |
| Finance Department Manager | Salah F Daou | |
| Marketing Manager | Hisham Manna | |
| HR Department Manager | Marwan Audeh | |
| IT Department Manager | Mohammed Abu Hayyah | |
| Reinsurance Department Manager | Ayed F Saleh | |
| Head of Motor Claims | Sulaiman Daher | |
| Motor Department Executive Manager | Mohammed Khalaf |
ABNIC: Main technical highlights: 2011 - 2015
in USD
| 2011 | 2012 | 2013 | 2014 | 2015 | |
|---|---|---|---|---|---|
Gross written premiums | 170 696 000 | 152 253 000 | 139 644 396 | 153 477 928 | 168 856 853 |
Gross earned premiums | 170 696 363 | 152 253 205 | 141 497 871 | 149 340 976 | 168 414 894 |
Gross incurred losses | 129 147 714 | 114 204 993 | 134 951 002 | 120 272 308 | 127 439 877 |
Management expenses | 9 453 418 | 9 953 331 | 10 060 103 | 10 219 518 | 12 738 651 |
Commissions | 5 571 159 | 5 472 383 | 3 961 365 | 4 798 056 | 5 319 627 |
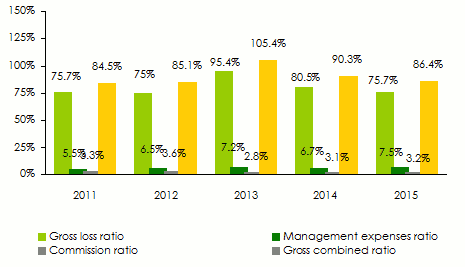
Gross loss ratio | 75.7% | 75% | 95.4% | 80.5% | 75.7% |
Gross expenses ratio (1) | 5.5% | 6.5% | 7.2% | 6.7% | 7.5% |
Gross commission ratio (2) | 3.3% | 3.6% | 2.8% | 3.1% | 3.2% |
Gross combined ratio | 84.5% | 85.1% | 105.4% | 90.3% | 86.4% |
Technical result | 23 644 412 | 23 300 887 | 16 016 752 | 15 180 668 | 16 921 210 |
Net result | 6 906 903 | 4 659 103 | 2 824 297 | 7 165 998 | 9 297 630 |
(1)Expenses ratio = management expenses / gross written premiums
(2)Commission ratio = commissions / gross written premiums
ABNIC: Evolution of premiums, claims and results: 2011-2015
in thousands USD 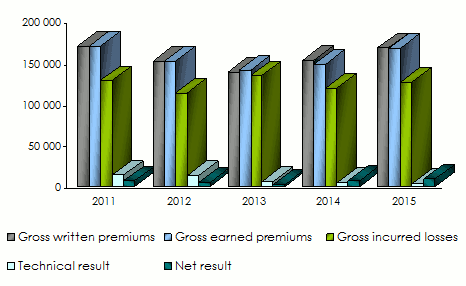
ABNIC: Evolution of gross technical ratios: 2011-2015
ABNIC: Breakdown of turnover per class of business: 2013 - 2015
in USD
| 2013 | 2014 | 2015 | 2015 shares | |
|---|---|---|---|---|
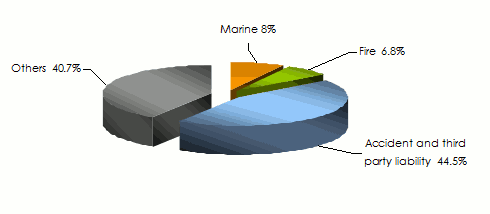
Marine | 12 637 503 | 10 059 951 | 13 430 240 | 8% |
Fire | 11 649 666 | 10 799 032 | 11 503 181 | 6,8% |
Accident and third party liability | 71 014 184 | 74 930 833 | 75 206 290 | 44,5% |
Others | 44 343 043 | 57 688 112 | 68 717 142 | 40,7% |
Total | 139 644 396 | 153 477 928 | 168 856 853 | 100% |
ABNIC: Breakdown of 2015 turnover per class of business
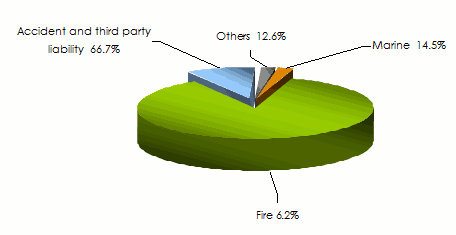
ABNIC: Technical result per class of business: 2013-2015
in USD
| 2013 | 2014 | 2015 | 2015shares | |
|---|---|---|---|---|
Marine | 2 589 573 | 2 537 823 | 2 443 958 | 14.5% |
Fire | 988 611 | 1 370 496 | 1 056 325 | 6.2% |
Accident and third party liability | 6 861 235 | 4 187 280 | 11 290 209 | 66.7% |
Others | 5 577 333 | 7 085 069 | 2 130 718 | 12.6% |
Total | 16 016 752 | 15 180 668 | 16 921 210 | 100% |
ABNIC: Gross earned premiums per class of business : 2013-2015
in USD
| 2013 | 2014 | 2015 | |
|---|---|---|---|
Marine | 13 315 224 | 11 288 559 | 13 989 517 |
Fire | 11 219 963 | 11 137 574 | 10 623 374 |
Accident and third party liability | 73 279 335 | 69 180 607 | 76 066 139 |
Others | 43 683 349 | 57 734 236 | 67 735 864 |
Total | 141 497 871 | 149 340 976 | 168 414 894 |
ABNIC: Gross incurred losses per class of business: 2013-2015
in USD
| 2013 | 2014 | 2015 | |
|---|---|---|---|
Marine | 6 977 054 | 8 534 452 | 3 738 087 |
Fire | 13 683 402 | 1 805 432 | 536 543 |
Accident and third party liability | 73 637 552 | 60 896 087 | 62 253 802 |
Others | 40 652 994 | 49 036 337 | 60 911 445 |
Total | 134 951 002 | 120 272 308 | 127 439 877 |
ABNIC: Non life gross loss ratio: 2013-2015
| 2013 | 2014 | 2015 | |
|---|---|---|---|
Marine | 52.4% | 75.6% | 26.7% |
Fire | 122% | 16.2% | 5.1% |
Accident and third party liability | 100.5% | 88% | 81.8% |
Others | 93,1% | 84.9% | 89.9% |
Total | 95.4% | 80.5% | 75.7% |
Source: Figures taken from ABNIC’s different balance sheets
Exchange rate AED/USD as at 31/12 | 2011 | 2012 | 2013 | 2014 | 2015 |
0.27230 | 0.27226 | 0,27230 | 0.27231 | 0.27234 |

ABNIC
| Head office | Al Buhaira Tower, Khalid Lagoon, BP 6000, Sharjah, United Arab Emirates |
| Tel | +971 6 5174444 |
| Fax | +971 6 5748855 |
| Website |