Britam Holdings Limited Kenya

- Date of creation: 1965, Nairobi, Kenya.
- Activities: Life and life insurance, retirement and financial services.
- Staff members : More than 900 employees.
Britam in 2022
|


Management
| Kuria Muchiru | Chairman of the Board of Directors |
| Tom Gitogo | Chief Executive Officer (CEO) |
| Charles Kimani | Chief Financial Officer (CFO) |
| Ambrose Dabani | CEO of Britam Life Assurance Company |
| Jackson Theuri | CEO of Britam General Insurance Company |
| Catherine Karita | Director, Strategy & Investor Relations |
| Kennedy B. Aosa | Director, International Insurance Business |
Shareholding as at 31/12/2022
| Shareholders | Shares |
| AfricInvest Group | 17.55% |
| Equity Holdings Limited | 16.05% |
| Swiss Re AG | 15.79% |
| Others | 50.61% |
Britam General Insurance Company
|

Britam General Insurance in 2022
| Share capital | 21 477 000 USD |
| Turnover | 87 348 000 USD |
| Assets | 108 849 000 USD |
| Fhareholder’s equity | 26 285 000 USD |
| Net result | 1 765 000 USD |
| Net non-life loss ratio | 66.21% |
| Net non-life management expenses ratio | 34.96% |
| Net non-life combined ratio | 101.17% |
Main technical highlights
Figures in thousands USD
| Highlights | 2018 | 2019 | 2020 | 2021 | 2022 |
|---|---|---|---|---|---|
| Gross written premiums | 78 556 | 80 281 | 75 111 | 86 763 | 87 348 |
| Net written premiums | 63 384 | 63 052 | 60 857 | 64 486 | 62 912 |
| Net earned premiums | 65 403 | 62 596 | 57 175 | 64 116 | 57 898 |
| Net incurred losses | 39 407 | 42 040 | 36 754 | 43 556 | 38 336 |
| Management expenses | 32 304 | 31 851 | 26 819 | 28 766 | 21 996 |
| Net non-life loss ratio (1) | 60.25% | 67.16% | 64.28% | 67.93% | 66.21% |
| Net non-life management expenses ratio (2) | 50.97% | 50.52% | 44.07% | 44.61% | 34.96% |
| Net non-life combined ratio (3) | 111.22% | 117.68% | 108.35% | 112.54% | 101.17% |
| Net result | -508 | -1 813 | 3 309 | 214 | 1 765 |
(1) Net non-life loss ratio = Net non-life incurred losses / Net non-life earned premiums
(2) Net non-life management expenses ratio = Non-life management expenses / Written premiums net of non-life reinsurance
(3) Net non-life combined ratio = Net non-life loss ratio + Net non-life management expenses ratio
Exchange rate as at 31/12/2022: 1 KES = 0.00805 USD ; 31/12/2021: 1 KES = 0.00878 USD ; at 31/12/2020: 1 KES = 0.0091 USD ; at 31/12/2019: 1 KES = 0.00978 USD ; at 31/12/2018: 1 KES = 0.00976 USD.
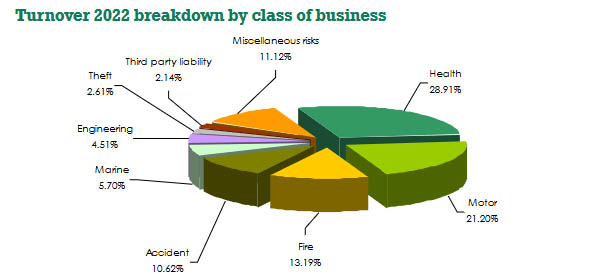
Turnover breakdown by non-life class of business
Figures in thousands USD
| Class of business | 2018 | 2019 | 2020 | 2021 | 2022 | Parts 2022 |
|---|---|---|---|---|---|---|
| Health | 19 909 | 17 394 | 16 385 | 21 414 | 25 255 | 28,91% |
| Motor | 25 028 | 24 517 | 22 878 | 19 514 | 18 514 | 21,20% |
| Fire | 5 729 | 8 024 | 6 826 | 8 708 | 11 523 | 13,19% |
| Accident (1) | 9 291 | 10 362 | 8 712 | 15 209 | 9 274 | 10,62% |
| Marine | 4 626 | 3 808 | 3 684 | 3 564 | 4 976 | 5,70% |
| Engineering | 3 280 | 4 324 | 3 573 | 4 318 | 3 937 | 4,51% |
| Theft | 1 953 | 2 110 | 2 146 | 2 240 | 2 281 | 2,61% |
| Third party liability | 1 287 | 1 426 | 1 551 | 1 754 | 1 874 | 2,14% |
| Miscellaneous risks | 7 453 | 8 316 | 9 356 | 10 042 | 9 714 | 11,12% |
| Non-life total | 78 556 | 80 281 | 75 111 | 86 763 | 87 348 | 100% |
(1) Including personal accident and workmen's compensation
Net earned premiums by non-life class of business
Figures in thousands USD
| Class of business | 2018 | 2019 | 2020 | 2021 | 2022 | 2021-2022 evolution |
|---|---|---|---|---|---|---|
| Health | 21 694 | 17 700 | 14 572 | 19 770 | 21 713 | 19.79% |
| Motor (1) | 23 691 | 23 045 | 21 582 | 20 118 | 22 148 | 20.08% |
| Fire | 2 292 | 2 223 | 3 342 | 2 828 | - | - |
| Accident (2) | 7 168 | 8 389 | 5 739 | 8 103 | - | - |
| Marine | 1 080 | 884 | 928 | 878 | 1 737 | 115.65% |
| Engineering | 338 | 71 | 255 | 394 | 390 | 7.96% |
| Theft | 1 753 | 2 034 | 1 747 | 1 616 | 1 631 | 10.14% |
| Third party liability | 580 | 668 | 827 | 871 | 801 | 0.24% |
| Miscellaneous risks | 6 807 | 7 582 | 8 183 | 9 538 | 9 478 | 8.38% |
| Non-life total | 65 403 | 62 596 | 57 175 | 64 116 | 57 898 | -1.51% |
(1) Including fire and accident in 2022
(2) Including personal accident and workmen's compensation
Net incurred losses by non-life class of business
Figures in thousands USD
| Class of business | 2018 | 2019 | 2020 | 2021 | 2022 | 2021-2022 evolution |
|---|---|---|---|---|---|---|
| Health | 15 737 | 13 046 | 8 861 | 13 738 | 16 632 | 32.04% |
| Motor | 15 745 | 20 186 | 18 868 | 19 412 | 13 834 | -22.27% |
| Fire | 867 | 885 | 839 | 960 | 566 | -35.67% |
| Accident (1) | 1 132 | 2 218 | 2 289 | 2 262 | 730 | -64.80% |
| Marine | 170 | 359 | 408 | 106 | 340 | 250.95% |
| Engineering | 298 | -76 | 477 | 453 | 96 | -76.87% |
| Theft | 1 662 | 947 | 148 | -21 | 129 | -758.26% |
| Third party liability | 138 | 314 | 258 | 462 | 521 | 22.91% |
| Miscellaneous risks | 3 658 | 4 161 | 4 606 | 6 184 | 5 488 | -3.21% |
| Non-life total | 39 407 | 42 040 | 36 754 | 43 556 | 38 336 | -4% |
(1) Including personal accident and workmen's compensation
Net loss ratio by non-life class of business
| Class of business | 2018 | 2019 | 2020 | 2021 | 2022 |
|---|---|---|---|---|---|
| Health | 72.54% | 73.71% | 60.81% | 69.49% | 76.60% |
| Motor (1) | 66.46% | 87.59% | 87.42% | 96.49% | 68.30% |
| Fire | 37.84% | 39.81% | 25.11% | 33.94% | - |
| Accident (2) | 15.79% | 26.44% | 39.88% | 27.92% | - |
| Marine | 15.72% | 40.63% | 44.02% | 12.04% | 19.60% |
| Engineering | 88.13% | -107.02% | 186.87% | 114.83% | 24.60% |
| Theft | 94.80% | 46.53% | 8.45% | -1.32% | 7.90% |
| Third party liability | 23.73% | 47.10% | 31.17% | 53.01% | 65.00% |
| Miscellaneous risks | 53.73% | 54.87% | 56.30% | 64.84% | 57.90% |
| Non-life total | 60.25% | 67.16% | 64.28% | 67.93% | 66.21% |
(1) Including fire and accident in 2022
(2) Including personal accident and workmen's compensation
Britam Life Assurance Company
 |
Ambrose Dabani CEO of Britam Life Assurance Company |
Britam General Insurance in 2022
| Share capital | 3 220 000 USD |
| Turnover | 228 497 000 USD |
| Assets | 956 835 000 USD |
| Shareholder’s equity | 79 659 000 USD |
| Net result | 12 666 000 USD |
Main technical highlights
Figures in thousands USD
| Highlights | 2018 | 2019 | 2020 | 2021 | 2022 |
|---|---|---|---|---|---|
| Gross written premiums | 201 238 | 234 150 | 212 150 | 227 350 | 228 497 |
| Net written premiums | 199 013 | 231 659 | 209 105 | 218 929 | 222 849 |
| Net result | -11 399 | 30 530 | -26 941 | 19 031 | 12 666 |
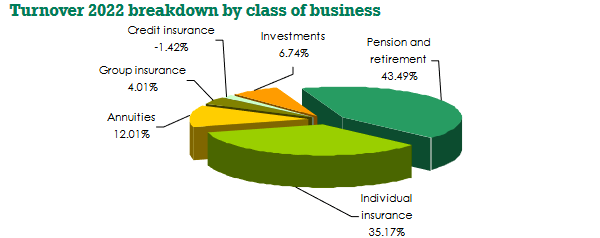
Turnover breakdown by life class of business
Figures in thousands USD
| Class of business | 2018 | 2019 | 2020 | 2021 | 2022 | 2022 shares |
|---|---|---|---|---|---|---|
| Pension and retirement | 79 941 | 92 061 | 89 867 | 90 828 | 99 369 | 43.49% |
| Individual insurance | 77 567 | 85 635 | 79 250 | 84 902 | 80 370 | 35.17% |
| Annuities | 15 416 | 29 795 | 13 702 | 6 634 | 27 449 | 12.01% |
| Group insurance | 10 586 | 5 382 | 6 567 | 13 005 | 9 152 | 4.01% |
| Credit insurance | 11 925 | 14 561 | 13 069 | 20 093 | -3 242 | -1.42% |
| Investments | 5 803 | 6 716 | 9 695 | 11 888 | 15 399 | 6.74% |
| Life total | 201 238 | 234 150 | 212 150 | 227 350 | 228 497 | 100% |

Britam : Contact
| Head office | Britam Holdings Limited, P.O. Box 30375-00100, Mara/Ragati Road Junction Upperhill, Nairobi, Kenya. |
| Phone | (020) 2833000 / +254 703 094 000 |
| Fax | (020) 2717626 / 2714927 |
info [at] britam [dot] com | |
| Website |