Britam Holdings Limited Kenya

- Date de création : 1965, Nairobi, Kenya
- Activités : Assurance vie, non vie, retraite et services financiers
- Effectifs : Plus de 900 employés
Britam en 2022
|


Management
| Kuria Muchiru | Président du conseil d’administration |
| Tom Gitogo | Directeur général (CEO) |
| Charles Kimani | Directeur financier, CFO |
| Ambrose Dabani | CEO de Britam Life Assurance Company |
| Jackson Theuri | CEO de Britam General Insurance Company |
| Catherine Karita | Directrice stratégie et relation avec les investisseurs |
| Kennedy B. Aosa | Directeur affaires Internationales, Insurance Business |
Actionnariat au 31/12/2022
| Actionnaires | Participations |
| AfricInvest Group | 17,55% |
| Equity Holdings Limited | 16,05% |
| Swiss Re AG | 15,79% |
| Autres | 50,61% |
Britam General Insurance Company
|

Britam General Insurance en 2022
| Capital social | 21 477 000 USD |
| Chiffre d’affaires | 87 348 000 USD |
| Actifs | 108 849 000 USD |
| Fonds propres | 26 285 000 USD |
| Résultat net | 1 765 000 USD |
| Ratio sinistres à primes net non vie | 66,21% |
| Ratio frais de gestion net non vie | 34,96% |
| Ratio combiné net non vie | 101,17% |
Principaux indicateurs techniques
Chiffres en milliers USD
| Indicateurs | 2018 | 2019 | 2020 | 2021 | 2022 |
|---|---|---|---|---|---|
| Primes émises brutes | 78 556 | 80 281 | 75 111 | 86 763 | 87 348 |
| Primes émises nettes | 63 384 | 63 052 | 60 857 | 64 486 | 62 912 |
| Primes acquises nettes | 65 403 | 62 596 | 57 175 | 64 116 | 57 898 |
| Charges de sinistres nettes | 39 407 | 42 040 | 36 754 | 43 556 | 38 336 |
| Frais de gestion | 32 304 | 31 851 | 26 819 | 28 766 | 21 996 |
| Ratio sinistres à primes net non vie (1) | 60,25% | 67,16% | 64,28% | 67,93% | 66,21% |
| Ratio frais de gestion net non-vie (2) | 50,97% | 50,52% | 44,07% | 44,61% | 34,96% |
| Ratio combiné net non vie (3) | 111,22% | 117,68% | 108,35% | 112,54% | 101,17% |
| Résultat net | -508 | -1 813 | 3 309 | 214 | 1 765 |
(1) Ratio sinistres à primes net non vie = Charge de sinistres nette non vie / Primes acquises nettes non vie
(2) Ratio frais de gestion net non vie = Frais de gestion non vie / Primes émises nettes de réassurance non vie
(3) Ratio combiné net non vie = Ratio sinistres à primes net non vie + Ratio frais de gestion net non vie
Taux de change au 31/12/2022 : 1 OMR = 2,58954 USD ; 31/12/2021 : 1 OMR = 2,58961 USD ; 31/12/2020 : 1 OMR = 2,59113 USD ; au 31/12/2019 : 1 OMR = 2,59079 USD ; au 31/12/2018 : 1 OMR = 2,59062 USD.
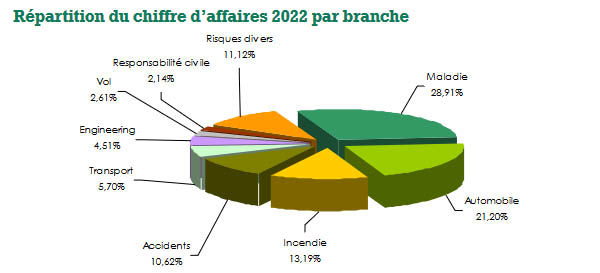
Répartition du chiffre d’affaires par branche
Chiffres en milliers USD
| Branches | 2018 | 2019 | 2020 | 2021 | 2022 | Parts 2022 |
|---|---|---|---|---|---|---|
| Maladie | 19 909 | 17 394 | 16 385 | 21 414 | 25 255 | 28,91% |
| Automobile | 25 028 | 24 517 | 22 878 | 19 514 | 18 514 | 21,20% |
| Incendie | 5 729 | 8 024 | 6 826 | 8 708 | 11 523 | 13,19% |
| Accidents (1) | 9 291 | 10 362 | 8 712 | 15 209 | 9 274 | 10,62% |
| Transport | 4 626 | 3 808 | 3 684 | 3 564 | 4 976 | 5,70% |
| Engineering | 3 280 | 4 324 | 3 573 | 4 318 | 3 937 | 4,51% |
| Vol | 1 953 | 2 110 | 2 146 | 2 240 | 2 281 | 2,61% |
| Responsabilité civile | 1 287 | 1 426 | 1 551 | 1 754 | 1 874 | 2,14% |
| Risques divers | 7 453 | 8 316 | 9 356 | 10 042 | 9 714 | 11,12% |
| Total non vie | 78 556 | 80 281 | 75 111 | 86 763 | 87 348 | 100% |
(1) y compris individuelle accident et accidents du travail
Primes acquises nettes par branche non vie
Chiffres en milliers USD
| 2018 | 2019 | 2020 | 2021 | 2022 | Evolution 2021-2022 | |
|---|---|---|---|---|---|---|
| Maladie | 21 694 | 17 700 | 14 572 | 19 770 | 21 713 | 19,79% |
| Automobile (1) | 23 691 | 23 045 | 21 582 | 20 118 | 22 148 | 20,08% |
| Incendie | 2 292 | 2 223 | 3 342 | 2 828 | - | - |
| Accidents (2) | 7 168 | 8 389 | 5 739 | 8 103 | - | - |
| Transport | 1 080 | 884 | 928 | 878 | 1 737 | 115,65% |
| Engineering | 338 | 71 | 255 | 394 | 390 | 7,96% |
| Vol | 1 753 | 2 034 | 1 747 | 1 616 | 1 631 | 10,14% |
| Responsabilité civile | 580 | 668 | 827 | 871 | 801 | 0,24% |
| Risques divers | 6 807 | 7 582 | 8 183 | 9 538 | 9 478 | 8,38% |
| Total non vie | 65 403 | 62 596 | 57 175 | 64 116 | 57 898 | -1,51% |
(1) Y compris incendie et accidents en 2022
(2) y compris individuelle accident et accidents du travail
Charges sinistres nettes par branche non vie
Chiffres en milliers USD
| 2018 | 2019 | 2020 | 2021 | 2022 | Evolution 2021-2022 | |
|---|---|---|---|---|---|---|
| Maladie | 15 737 | 13 046 | 8 861 | 13 738 | 16 632 | 32,04% |
| Automobile | 15 745 | 20 186 | 18 868 | 19 412 | 13 834 | -22,27% |
| Incendie | 867 | 885 | 839 | 960 | 566 | -35,67% |
| Accidents (1) | 1 132 | 2 218 | 2 289 | 2 262 | 730 | -64,80% |
| Transport | 170 | 359 | 408 | 106 | 340 | 250,95% |
| Engineering | 298 | -76 | 477 | 453 | 96 | -76,87% |
| Vol | 1 662 | 947 | 148 | -21 | 129 | -758,26% |
| Responsabilité civile | 138 | 314 | 258 | 462 | 521 | 22,91% |
| Risques divers | 3 658 | 4 161 | 4 606 | 6 184 | 5 488 | -3,21% |
| Total non vie | 39 407 | 42 040 | 36 754 | 43 556 | 38 336 | -4% |
(1) y compris individuelle accident et accidents du travail
Ratio sinistres à primes net par branche non vie
| 2018 | 2019 | 2020 | 2021 | 2022 | |
|---|---|---|---|---|---|
| Maladie | 72,54% | 73,71% | 60,81% | 69,49% | 76,60% |
| Automobile (1) | 66,46% | 87,59% | 87,42% | 96,49% | 68,30% |
| Incendie | 37,84% | 39,81% | 25,11% | 33,94% | - |
| Accidents (2) | 15,79% | 26,44% | 39,88% | 27,92% | - |
| Transport | 15,72% | 40,63% | 44,02% | 12,04% | 19,60% |
| Engineering | 88,13% | -107,02% | 186,87% | 114,83% | 24,60% |
| Vol | 94,80% | 46,53% | 8,45% | -1,32% | 7,90% |
| Responsabilité civile | 23,73% | 47,10% | 31,17% | 53,01% | 65,00% |
| Risques divers | 53,73% | 54,87% | 56,30% | 64,84% | 57,90% |
| Total non vie | 60,25% | 67,16% | 64,28% | 67,93% | 66,21% |
(1) Y compris incendie et accidents en 2022
(2) y compris individuelle accident et accidents du travail
Britam Life Assurance Company
 |
Ambrose Dabani CEO Britam Life Assurance Company |
Britam General Insurance en 2022
| Capital social | 3 220 000 USD |
| Chiffre d’affaires | 228 497 000 USD |
| Actifs | 956 835 000 USD |
| Fonds propres | 79 659 000 USD |
| Résultat net | 12 666 000 USD |
Principaux indicateurs techniques
Chiffres en milliers USD
| Indicateurs | 2018 | 2019 | 2020 | 2021 | 2022 |
|---|---|---|---|---|---|
| Primes émises brutes | 201 238 | 234 150 | 212 150 | 227 350 | 228 497 |
| Primes émises nettes | 199 013 | 231 659 | 209 105 | 218 929 | 222 849 |
| Résultat net | -11 399 | 30 530 | -26 941 | 19 031 | 12 666 |
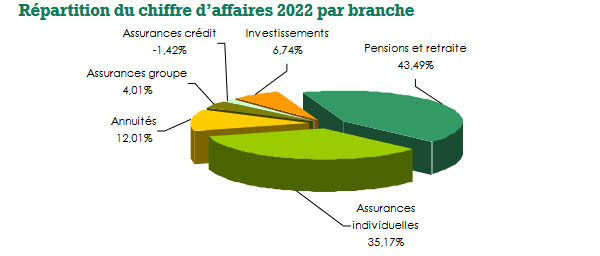
Répartition du chiffre d’affaires par branche vie
Chiffres en milliers USD
| Branches | 2018 | 2019 | 2020 | 2021 | 2022 | Parts 2022 |
|---|---|---|---|---|---|---|
| Pensions et retraite | 79 941 | 92 061 | 89 867 | 90 828 | 99 369 | 43,49% |
| Assurances individuelles | 77 567 | 85 635 | 79 250 | 84 902 | 80 370 | 35,17% |
| Annuités | 15 416 | 29 795 | 13 702 | 6 634 | 27 449 | 12,01% |
| Assurances groupe | 10 586 | 5 382 | 6 567 | 13 005 | 9 152 | 4,01% |
| Assurances crédit | 11 925 | 14 561 | 13 069 | 20 093 | -3 242 | -1,42% |
| Investissements | 5 803 | 6 716 | 9 695 | 11 888 | 15 399 | 6,74% |
| Total vie | 201 238 | 234 150 | 212 150 | 227 350 | 228 497 | 100% |

Britam : Contact
| Siège social | Britam Holdings Limited, P.O. Box 30375-00100, Mara/Ragati Road Junction Upperhill, Nairobi, Kenya. |
| Tél | (020) 2833000 / +254 703 094 000 |
| Fax | (020) 2717626 / 2714927 |
info [at] britam [dot] com | |
| Site web |
- Vous devez vous identifier ou créer un compte pour écrire des commentaires
