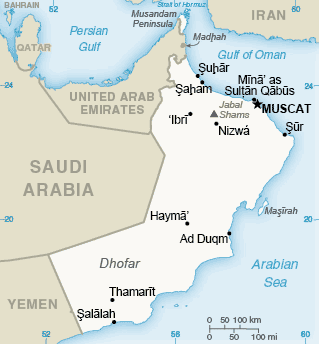
Omani insurance market in 2022

The Omani insurance market features
- Regulatory authority : Capital Market Authority - Insurance Supervision Department
- Life and non-life premiums (2022): 1.402 billion USD
- Insurance density (2022): 306 USD
- Penetration rate (2022): 1.22%
Structure of the Omani insurance market in 2022
Market players | Total |
|---|---|
Insurance companies | 17 |
Takaful companies | 2 |
Reinsurance companie | 1 |
Insurance brokers | 30 |
Healthcare service providers | 4 |
Total | 54 |
* at 31/12/2022
Identity
- Surface area: 309 500 km2
- Population (1) (2022): 4 576 000 inhabitants
- GDP (1) (20122): 114.67 billion USD
- GDP per inhabitant (2022): 25 057 USD
- GDP growth rate (2022): 4.3%
- Inflation rate (1) (2022): 2.8%
- Main sectors of activity: oil production, natural gas, asbestos, copper, steel, manufacturing industries, metalworking industries, tourism, services.
(1) Source: World Bank
Main cities
(per number of inhabitants)
- Muscat (capital): 1 623 000
- Salalah: 440 000
- Suhar : 231 100
The Omani insurance industry: evolution of premiums per life and non life class of business (2018-2022)
Figures in thousands USD| 2018 | 2019 | 2020 | 2021 | 2022 | |
|---|---|---|---|---|---|
Life | 154 481 | 157 266 | 139 279 | 148 439 | 174 201 |
Non life | 1 046 517 | 1 103 366 | 1 067 916 | 1 094 204 | 1 227 584 |
Total | 1 200 998 | 1 260 632 | 1 207 195 | 1 242 643 | 1 401 785 |
The Omani insurance industry: turnover by class of business 2021-2022
Figures in thousands USD| Classes of business | 2021 | 2022 | 2021-2022 evolution (1) | 2022 shares |
|---|---|---|---|---|
| Health | 424 349 | 495 941 | 16.87% | 35.38% |
| Motor | 265 689 | 275 897 | 3.85% | 19.68% |
| Property damage | 197 629 | 233 126 | 17.96% | 16.63% |
| Engineering | 63 044 | 66 062 | 4.79% | 4.71% |
| Marine | 33 222 | 36 901 | 11.08% | 2.63% |
| Third party liability | 33 994 | 35 917 | 5.66% | 2.56% |
| Other risks | 76 277 | 83 740 | 9.79% | 5.98% |
| Non-life total | 1 094 204 | 1 227 584 | 12.19% | 87.57% |
| Group insurance | 106 697 | 126 745 | 18.79% | 9.04% |
| Individual insurance | 41 742 | 47 456 | 13.69% | 3.39% |
| Life total | 148 439 | 174 201 | 17.36% | 12.43% |
| Market total | 1 242 643 | 1 401 785 | 12.81% | 100% |
(1) Growth rate in local currency
Marché omanais de l'assurance : net non-life loss ratio 2018-2022
| 2018 | 2019 | 2020 | 2021 | 2022 | |
|---|---|---|---|---|---|
| National companies | 101.11% | 64.32% | 60.37% | 62.60% | 56.30% |
| Foreign companies | 64.44% | 52.54% | 52.27% | 54.40% | 43.50% |
| Market total | 95.13% | 62.66% | 59.21% | 61.40% | 54.60% |
Exchange rate OMR/USD as at 31/12 | 2018 | 2019 | 2020 | 2021 | 2022 |
2.59062 | 2.59079 | 2.59113 | 2.58961 | 2.58954 |
0
Your rating: None
Mon, 26/02/2024 - 10:44
The online magazine
Live coverage
04/24
04/24
04/24
04/24
04/23
Latest news
