
The American insurance market has been growing continuously from 2000 to the end of 2021, with a 331% increase. Meanwhile, during the same period, the Chinese insurance industry has grown by 3 302%.
China began from a very low base, which explains this exceptional growth rate. These figures do not call into question the strength of the American market.
The domination of the United States over the global insurance market has gathered momentum during 2000-2021 period. The American underwriting share went up from 25% of the global premiums in 2000 to 40% by the end of 2021.
Over a shorter period, that is, from 2011 to 2021, global premiums rose by 49%. The United States, whose growth was threatened by the subprime crisis, recorded a 65% increase in premium volume during that same period, a long way from the rates achieved in the early 2000s.
The Chinase insurance market, on the other hand, has slowed its growth rate, but still recorded a 213% surge. Japan, caught up in a long-term economic crisis, witnessed a significant decline with its premium volume declining by 38%.
The American insurance market: well-balanced life and non-life activities
Globally, life insurance premiums accounted for 41% of the total premiums in 2021. This proportion stood at 48% in 2000 and 47% by the end of 2011.
In the United States, non-life activities (including health and accidents risks) dominated the American market with 59% of total premiums in 2021. Still in the USA, this non-life business had a 51% market share in 2000 and 52% in 2011.
In millions USD
| 2000 | 2011 | 2021 | |||||||
| Life | Non Life | Total | Life | Non Life | Total | Life | Non Life | Total | |
| United States | 308 127 | 325 013 | 633 140 | 785 400 | 865 116 | 1 650 516 | 1 113 000 | 1 619 913 | 2 732 913 |
| China | 10 282 | 8 997 | 19 279 | 134 539 | 87 319 | 221 858 | 265 456 | 330 672 | 596 128 |
| Japan | 411 733 | 101 946 | 513 679 | 524 668 | 130 471 | 655 139 | 295 850 | 107 741 | 403 591 |
| Europe | 520 663 | 284 165 | 804 828 | 937 168 | 713 699 | 1 650 867 | 1 053 553 | 774 302 | 1 827 855 |
| World | 1 552 062 | 938 637 | 2 490 699 | 2 626 944 | 1 968 179 | 4 595 123 | 2 997 569 | 3 863 029 | 6 860 598 |
Sources: NAIC and Sigma
Read also | Top 25 insurance companies in the United States
The American insurance market: Evolution of life and non-life penetration rate
The penetration rate is an interesting indicator used to evaluate the importance and the weight of the insurance activity in a country or region. At a global scale, insurance is decreasing in the GDP. Between 2000 and 2021, the global penetration rate went from 7.3% to 7.0% for both life and non-life insurance.
The analysis by major classes of business indicates that this decline is due to the decline in life insurance activity whose penetration rate dropped from 4.6% in 2000 to 3.0% in 2021. The non-life sector on the other hand, gained 1.2 points, rising form 2.7% in 2000 to 3.9% in 2021.
According to the penetration rate analysis, the major European and Japanese markets were in decline over the period 2000-2021. Only China stood out with a penetration rate growth of about 160% between 2000 and 2021 (1.5% in 2000 and 3.9% in 2021).
In the United States, in 2000, the two classes of business, life and non-life, each represented 4.2% of GDP. By the end of 2021, life insurance fell to 2.6% while the non-life activity progressed to reach 9.10%.
Penetration rate of the main markets: 2000-2021
| 2000 | 2011 | 2021 | |||||||
| Life | Non Life | Total | Life | Non Life | Total | Life | Non Life | Total | |
| United States | 4.20% | 4.20% | 8.40% | 3.60% | 4.50% | 8.10% | 2.60% | 9.10% | 11.70% |
| China | 0.80% | 0.70% | 1.50% | 1.80% | 1.20% | 3.00% | 2.10% | 1.90% | 3.90% |
| Japan | 8.60% | 2.10% | 10.70% | 8.80% | 2.20% | 11.00% | 6.10% | 2.20% | 8.40% |
| Europe | 5.10% | 2.70% | 7.80% | 4.10% | 3.00% | 7.10% | 2.70% | 2.30% | 5.00% |
| World | 4.60% | 2.70% | 7.30% | 3.80% | 2.80% | 6.60% | 3.00% | 3.90% | 7.00% |
Read also | U.S non-life insurance market
The American insurance market: Evolution of life and non-life insurance density
The highest per capita insurance consumption is in the United States with 8 193 USD per person in 2021. This was not always the case in the past. In 2000, a Japanese person has underwritten 4 027 USD of insurance premiums per year, while an American was only at 3 076 USD.
Remarkably, the growth in density is mainly attributed to the non-life class of business (including health), which went from 1 529 USD in 2000 to 6 356 USD in 2021, a growth of 316%. The life activity has grown by only 19% in 21 years, or about 0.9% annually.
Insurance density of the main markets: 2000-2021
Figures in USD
| 2000 | 2011 | 2021 | |||||||
| Life | Non Life | Total | Life | Non Life | Total | Life | Non Life | Total | |
| United States | 1 547 | 1 529 | 3 076 | 1 716 | 2 130 | 3 846 | 1 837 | 6 356 | 8 193 |
| China | 8 | 7 | 15 | 99 | 64 | 163 | 253 | 229 | 482 |
| Japan | 3 228 | 799 | 4 027 | 4 138 | 1 031 | 5 169 | 2 347 | 885 | 3 202 |
| Europe | 648 | 336 | 984 | 1 083 | 802 | 1 886 | 1 529 | 1 096 | 2 625 |
| World | 252 | 150 | 402 | 378 | 283 | 661 | 382 | 492 | 874 |
Sources: Sigma
The American insurance market and GDP
Penetration rate, insurance density and GDP growth are correlated. In fast growing economies, there is often an increase in demand for insurance products, which is reflected by a higher penetration rate. The growth of the insurance industry can then exceed the growth of overall GDP.
Evolution of the American GDP and insurance growth rates
| 2000 | 2011 | 2013 | 2015 | 2017 | 2019 | 2021 | ||||||||
| Growth rate (1) | GDP | Ins. | GDP | Ins. | GDP | Ins. | GDP | Ins. | GDP | Ins. | GDP | Ins. | GDP | Ins. |
| United States | 1.00% | 7.20% | 1.60% | 5.60% | 1.70% | -1.31% | 2.90% | 3.12% | 2.30% | 2.86% | 4.65% | 3.88% | 10.69% | 8.65% |
| China | 8.50% | 32.20% | 9.60% | 3.30% | 7.80% | 13.28% | 6.90% | 17.70% | 6.90% | 16.16% | 5.38% | 7.39% | 20.43% | 6.14% |
| Japan | 2.50% | 22.00% | -0.10% | 14.70% | 2.00% | -15.19% | 1.40% | -5.60% | 1.70% | -6.50% | 2.57% | 4.78% | -5.47% | -2.63% |
| Europe | 4.10% | -2.30% | 2.30% | 2.23% | 0.80% | 5.91% | 1.80% | -13.30% | 2.60% | 2.09% | -3.40% | -1.65% | 13.11% | 14.25% |
| World | 4.20% | -1.48% | 3.20% | 5.90% | 2.60% | 0.91% | 2.90% | -4.20% | 3.30% | 4.01% | 2.00% | 2.34% | 16.58% | 9.04% |
(1) Growth measured from the year Y and Y-1
Source : Sigma
The American insurance market from 2007 to 2017
The American insurance market comprises two main classes of business: life and health on the one hand and property and casualty (non life) on the other.
Growing steadily over a long period of time, that is, 6.5% on average per year between 2011 and 2021, the development of the American market, all classes of business included, has been disrupted by the COVID-19 crisis. The pandemic has had a significant impact on the insurance industry.
On a short-term basis, the industry was faced with a wave of business interruption claims, as well as an increase in mortality claims for life insurance policies. Within a year, between 2020 and 2021, life and health premiums grew by 7.6%, while property and casualty premiums declined by 9.2%.
The U.S. market by major classes of business
The American insurance market includes:
- Life companies and fraternal companies. Companies such as MetLife, Prudential and Anthem are key players in the life market. Fraternal companies are non-profit affinity companies that provide insurance services to their members: death, disability and health coverage.
- Health insurance companies are a key component of the U.S. insurance market. These companies provide coverage for health risks including illness and injury. The leaders in this sector are UnitedHealth Group, Cigna and Humana.
- Property & Casualty, which includes liability and property insurance, is the largest insurance market in the United States. This class of business underwrites a wide range of risks, including natural catastrophes and home equity coverage.
Evolution of premiums: 2011-2021
In millions USD
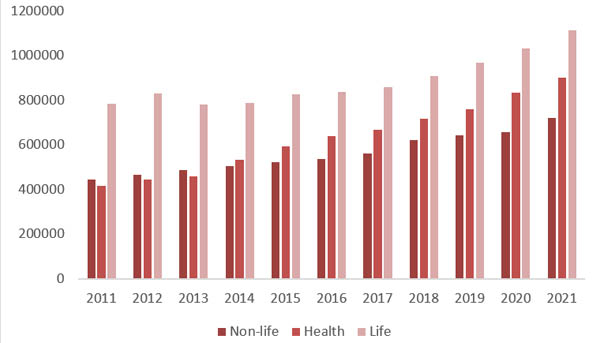
Source: NAIC data
With a share of almost 41%, the life class of business accounted for 1 113 billion USD of premiums in 2021. This activity's market share in the total American premiums has been decreasing since 2011. In ten years, life premiums have only evolved by 41.7%, while the non-life ones have grown by 61.1%, with stable market shares; 27.06% in 2011 to 26.34% in 2021.
It is the health class of business, with a 115.1% growth between 2011 and 2021, that is driving the current growth of the American market.
In millions USD
| Year | Non-life | Market share | Health | Market share | Life | Market share | Total |
| 2021 | 719 815 | 26.34% | 900 098 | 32.94% | 1 113 000 | 40.73% | 2 732 913 |
| 2020 | 658 913 | 26.07% | 834 725 | 33.02% | 1 034 300 | 40.91% | 2 527 938 |
| 2019 | 642 984 | 27.10% | 761 738 | 32.10% | 968 300 | 40.80% | 2 373 022 |
| 2018 | 621 786 | 27.66% | 716 190 | 31.86% | 909 600 | 40.47% | 2 247 576 |
| 2017 | 561 952 | 26.89% | 668 521 | 31.99% | 859 000 | 41.11% | 2 089 473 |
| 2016 | 537 926 | 26.73% | 638 259 | 31.71% | 836 300 | 41.56% | 2 012 485 |
| 2015 | 524 006 | 26.95% | 593 403 | 30.52% | 826 600 | 42.52% | 1 944 009 |
| 2014 | 506 657 | 27.71% | 533 083 | 29.16% | 788 600 | 43.13% | 1 828 340 |
| 2013 | 486 462 | 28.15% | 459 274 | 26.58% | 782 100 | 45.26% | 1 727 836 |
| 2012 | 465 743 | 26.78% | 443 537 | 25.50% | 829 800 | 47.71% | 1 739 080 |
| 2011 | 446 634 | 27.06% | 418 482 | 25.35% | 785 400 | 47.59% | 1 650 516 |
Source: NAIC data, iii.org
Main highlights : 2000-2021
| 2000 | 2011 | 2021 | |
| GDP | 10.28 trillion USD | 15.6 trillion USD | 23.32 trillion USD |
| GDP growth | 1% | 1.50% | 5.90% |
| Population | 282 million inhabitants | 311 million inhabitants | 331 million inhabitants |
| Total life and non-life premiums | 633.1 billion USD | 1 204 billion USD | 2 732 billion USD |
| Total life premiums | 308.1 billion USD | 537.5 billion USD | 1 113.0 billion USD |
| Total non-life premiums | 325 billion USD | 667.1 billion USD | 1 619.9 billion USD |
| Global insurance market share | 25.42% | 26.21% | 39.83% |
| Insurance penetration rate | 8.40% | 8.10% | 11.70% |
| Market density | 3 076 USD | 3 846 USD | 8 193 USD |