


Supported by rising demand and an optimized approach to risk, the reinsurance business remains dynamic and profitable. Against a favorable operating backdrop, the industry is maintaining a solid pace of growth.
According to data from Atlas Reinsurance Reports, premiums in 2024 totaled 394.694 billion USD (1), representing an average annual increase of 7% over the period 2015-2024. This growth momentum is also reflected in other key market indicators such as equity (+7.4%), net income (+10%), ROE, and the combined ratio.
The main reinsurance markets that is, Europe, Lloyd's, the Americas, Asia-Pacific, Africa, and the Middle East have all taken advantage of this favorable environment to achieve strong technical performance and consolidate their positions.
Direct insurance and reinsurance premiums: 2015-2024
Over the last ten years, from 2015 to 2024, the volume of premiums written by the reinsurance market has grown by 84%, compared with 70% for direct insurance.
The share of reinsurance, which represented 4.7% of direct premiums in 2015, stood at 5.1% in 2024.
Figures in millions USD
| 2015 | 2016 | 2017 | 2018 | 2019 | 2020 | 2021 | 2022 | 2023 | 2024 | Δ 2015-2024 | |
| Insurance premiums (*) | 4 598 680 | 4 702 841 | 4 957 507 | 6 149 020 | 6 284 360 | 6 291 834 | 6 764 694 | 6 772 753 | 7 276 000 | 7 799 000 | 70% |
| Reinsurance premiums (**) | 215 013 | 221 628 | 268 318 | 270 034 | 309 004 | 347 407 | 386 127 | 366 668 | 374 713 | 394 694 | 84% |
| % reinsurance/ insurance | 4.7% | 4.7% | 5.4% | 4.4% | 4.9% | 5.5% | 5.7% | 5.4% | 5.1% | 5.1% | 8% |
(*) Direct insurance premiums, Source: Sigma
(**) Source Atlas Reinsurance Reports 2026
(1) Atlas Reinsurance Reports 2026: study conducted by Atlas Magazine, based on data from 154 reinsurers headquartered in Europe, the Americas, Africa, Asia, and the Middle East.
Global reinsurance market concentration
The reinsurance market remains highly concentrated in 2024. The top five players alone accounted for 40% of global premiums while the top ten held 59% of these premiums.
This prevalence can be explained by the financial strength of the major players in the market, their geographical diversification, and their broad underwriting power. They also have solid balance sheets, strong technical expertise, the ability to absorb shocks, and maintain optimized risk management.
During the 1980-2024 period, the market share of the top five players rose from 17% in 1980 to 40% in 2024, a share that peaked to 55% in 2017 before beginning to decline year on year.
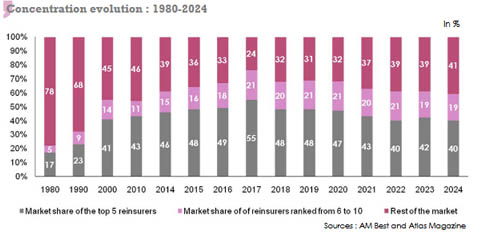
Read also | Top 20 reinsurers by gross written premiums
Key indicators for the reinsurance market: 2015-2024
The reinsurance market has been on an upward trajectory since 2015 thanks to a consistently attractive environment and interesting commercial opportunities, with improvement noted for all indicators.
Figures in millions USD
| 2015 | 2019 | 2022 | 2023 | 2024 | Δ 2023-2024 | Δ 2015-2024 (1) | |
| Gross written premiums | 215 012 | 309 004 | 366 668 | 374 713 | 394 694 | 5.3% | 7% |
| * Non-life | 150 012 | 216 188 | 259 873 | 275 148 | 293 169 | 6.5% | 7.7% |
| * Life | 65 000 | 92 816 | 106 795 | 99 565 | 101 525 | 2.0% | 5.1% |
| Net result | 36 263 | 40 313 | 11 614 | 76 744 | 85 734 | 11.7% | 10% |
| Shareholders’ equity | 617 557 | 859 767 | 891 144 | 1 059 114 | 1 177 114 | 11.1% | 7.4% |
| Combined ratio in % (2) | 90.4% | 100.1% | 96.2% | 90.3% | 91.3% | - | - |
| ROE (Return on Equity) in % (2) | 9.5% | 9.4% | 2.5% | 21.4% | 15.7% | - | - |
(1) Average annual growth rate
(2) Source: AM Best
Life and non-life reinsurance premiums in 2024
Non-life reinsurance remains the leading segment of the market. It consolidated its position in 2024, increasing its market share to 74% of total premiums, compared with 73% a year earlier.
This predominance of property and casualty business is particularly marked in Africa (87%), Asia (85%), and the Middle East (84%).
The dominance of non-life reinsurance is the result of strong demand for property coverage, fueled by the resurgence of natural disasters, rising insured values, and repair costs.
Figures in millions USD
| Life insurance | In % | Non-life insurance | In % | Total premiums | |
| Europe | 49 857 | 28% | 129 927 | 72% | 179 784 |
| Americas | 45 396 | 27% | 125 900 | 73% | 171 296 |
| Asia | 5 256 | 15% | 30 615 | 85% | 35 871 |
| Africa | 784 | 13% | 5 485 | 87% | 6 269 |
| Middle East | 232 | 16% | 1 242 | 84% | 1 474 |
| Reinsurance premiums | 101 525 | 26% | 293 169 | 74% | 394 694 |
Source: Atlas Magazine
Non-life reinsurance market
In 2024, all non-life and composite reinsurers, that is, 148 companies, reported 293 billion USD in non-life premiums, compared with 275 billion USD in 2023. This business accounts for 74% of the total market (life and non-life).
Six major European groups, led by Munich Re, are among the top ten non-life reinsurers. Munich Re reported 29.4 billion USD in non-life premiums, representing a 10% market share.
Lloyds ranks second, followed by the American company Berkshire Hathaway. Swiss Re ranks fourth, down from second place in 2023.
The non-life market remains highly concentrated, with the top ten players accounting for 56.4% of global non-life premiums in 2024.
Read also | Top 10 non-life reinsurers
Life reinsurance market
Life reinsurance is underwritten both by exclusively life reinsurers, whose number is only limited to six, and by composite life and non-life reinsurers (68 reinsurers).
All life operators, totaling 74 reinsurers, reported 101.5 billion USD in premiums in 2024, up 2% from the previous year.
The top three spots in the 2024 ranking go to Reinsurance Group of America, Swiss Re, and Great West Lifeco, with a combined market share of 49.5%.
During the same year, the top ten market players accounted for 91.5% of life insurance premiums while the 64 other reinsurers active in the sector shared the remaining 8.5%.
Despite the decline in the life insurance market's share to 26% in 2024 from 27% in 2023, this segment remains attractive. It is mainly driven by the boom in the US annuity market, rising interest rates, and mortality control following the peak observed during the Covid-19 crisis.
Read also | Top 10 life reinsurers
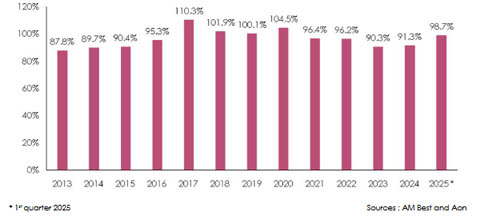
Global reinsurance market: the combined ratio
The reinsurance market's combined ratio has been on a downward trend since 2020. It is now below 100% thanks to a return to technical profitability after a period of high natural disaster claims between 2017 and 2020.
The policy of rate adjustments, risk control, and portfolio diversification has improved technical profitability.
In 2024, the combined ratio reached 91.3%, a slight increase from the 90.3% reported in 2023.
For 2025, a further deterioration in the combined ratio is foreseen due to the fires that occurred in California at the beginning of the year. According to Aon's Reinsurance Solutions, the combined ratio for the first quarter of 2025 is poised to reach 98.7%, while S&P's projections for the full year are set between 94% and 96%.
Technical ratios for the top 10 non-life reinsurers in 2024
The introduction of IFRS 17 as of 2022 has led to an improvement in the combined ratios of reinsurers that have adopted this standard. It is the case for Munich Re, Swiss Re, Hannover Re, and SCOR.
The new standard has changed the presentation of technical performance to provide a better understanding of the actual performance of reinsurance contracts.
Other players such as Lloyd's, Everest Re, Renaissance Re, and Arch Capital have seen their combined ratios deteriorate due to lower technical profitability, market volatility, and the impact of natural disasters.
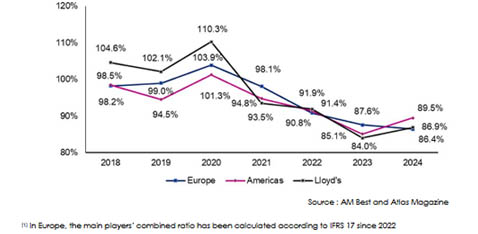
Combined ratios for the three main reinsurance markets: Continental Europe, the Americas, and Lloyd’s(1)
Over the 2018-2024 period, the downward trend in combined ratios is particularly marked in Continental Europe. In 2024, this market had the best combined ratio (86.4%) of the three main global reinsurance markets.
The Americas and Lloyd's face increased exposure to natural catastrophe and specialty risks, resulting in significantly higher loss ratios.
Global reinsurance market: net result
Since 2023, reinsurers' results across all regions have been improving. This improvement can be explained by a combination of technical, financial, and structural factors, including:
- high investment returns, reaching their highest level in a decade,
- a continued increase in rates after several years of high claims,
- a balance between risk and price, thereby improving technical margins,
- stricter contractual conditions: higher deductibles, better defined exclusions and limitations,
- great caution in capital allocation, favoring profitability over growth,
- geographic diversification of portfolios,
- structural reforms implemented since early 2023.
Despite the impact of natural disasters on first-half-2025 results, annual profitability for the current financial year is not expected to be significantly affected.
The market is expected to continue to post solid results in 2025 and 2026, in line with the performances achieved in 2023 (+560%) and 2024 (+12%).
Reinsurance market: net result by region (2015-2024)
In terms of reinsurance markets, Middle Eastern players achieved the highest net result growth between 2023 and 2024 (+75%), followed by Asian reinsurers (+67%), African reinsurers (+7%) and American reinsurers (+6%). Only the European market sustained its net profit decline by 1%.
Figures in millions USD
| Region | 2015 | 2019 | 2020 | 2021 | 2022 | 2023 | 2024 | Δ 2023-2024 | 2024% |
| Americas | 10 766 | 17 621 | 9 967 | 20 527 | -5 001 | 34 783 | 36 800 | 6% | 42.90% |
| Europe | 16 548 | 14 254 | 3 366 | 17 449 | 8 677 | 30 854 | 30 674 | -1% | 35.80% |
| Asia | 8 615 | 7 978 | 5 333 | 9 347 | 7 551 | 10 435 | 17 451 | 67% | 20.30% |
| Africa | 317 | 395 | 285 | -10 | 307 | 538 | 575 | 7% | 0.70% |
| Middle East | 17 | 66 | 24 | 71 | 80 | 134 | 234 | 75% | 0.30% |
| Total | 36 263 | 40 314 | 18 975 | 47 384 | 11 614 | 76 744 | 85 734 | 12% | 100% |
Source: Atlas Magazine
Read also | Global reinsurers: net result
Reinsurance market: Share capital
In 2024, the share capital of all market players fell slightly by 1.3% to 195.484 billion USD, compared with 198.095 billion USD a year earlier.
It is worth noting that the cumulative share capital of European players fell by 5% over the period, while that of the Americas remained stable at 113.728 billion USD.
At the same time, Africa's share capital grew by 9% and that of the Middle East jumped by 20%.
Share capital by region: 2015-2024
Figures in millions USD
| Region | 2015 | 2019 | 2023 | 2024 | Δ 2023-2024 | 2024% |
| Europe | 39 808 | 51 376 | 56 317 | 53 271 | -5% | 27.20% |
| Americas | 112 848 | 87 146 | 113 971 | 113 728 | 0% | 58.20% |
| Asia | 24 569 | 24 158 | 25 554 | 25 965 | 2% | 13.30% |
| Africa | 1 051 | 1 279 | 1 665 | 1 814 | 9% | 0.90% |
| Middle East | 555 | 526 | 588 | 706 | 20% | 0.40% |
| Total | 178 831 | 164 485 | 198 095 | 195 484 | -1.30% | 100% |
Source: Atlas Magazine
Reinsurance market: Shareholders’ equity
Reinsurers' shareholders’ equity rose by 11% in 2024, going from 1 059 billion USD in 2023 up to 1 177 billion USD in 2024. Over a longer period, between 2015 and 2024, this equity had grown by 91%, outpacing premiums (+84%).
US reinsurers contributed significantly to this growth, with their shareholders’ equity increasing by 160% over ten years.
The main contributor to this increase remains Berkshire Hathaway, whose shareholders’ equity grew by 15% in one year, from 567.5 billion in 2023 to 651.6 billion USD in 2024. However, these results should be viewed in context, given the specificities of their accounting treatment (1).
Holding 74.7% of global equity, reinsurers in the Americas are followed by their European counterparts. The other regions, namely Asia, Africa, and the Middle East, share the remainder, or 9.9% of equity.
The sustained growth in shareholders’ equity can be explained by improved profitability over the last two years, thanks to good financial results and a relative decline in natural disaster claims. All these factors have enabled reinsurers to consolidate their reserves.
In addition, the requirements of supervisory authorities and rating agencies in terms of financial strength and capitalization are encouraging companies to further consolidate their shareholders’ equity in order to maintain the robustness of their balance sheets.
(1) Figures for the Americas region are skewed by data provided by Berkshire Hathaway. The US conglomerate publishes the group's total equity, rather than equity dedicated solely to reinsurance activities.
Shareholders’ equity by region: 2015-2024
Figures in millions USD
| Region | 2015 | 2019 | 2023 | 2024 | Δ 2023-2024 | 2024% |
| Americas | 389 236 | 599 645 | 776 000 | 879 415 | 13% | 74.7% |
| Europe | 155 717 | 168 162 | 176 502 | 181 215 | 3% | 15.4% |
| Asia | 69 228 | 87 614 | 101 539 | 110 830 | 9% | 9.4% |
| Africa | 2 691 | 3 571 | 4 011 | 4 426 | 10% | 0.4% |
| Middle East | 684 | 774 | 1 062 | 1 228 | 16% | 0.1% |
| Total | 617 556 | 859 766 | 1 059 114 | 1 177 114 | 11% | 100% |
Source: Atlas Magazine
Read also | Top 20 reinsurers by Shareholders’ equity
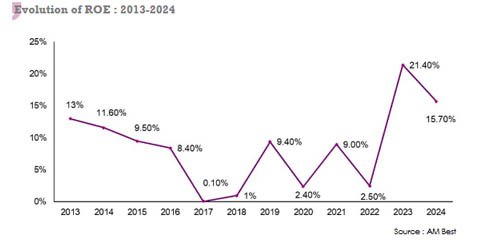
Reinsurance market: Return On Equity (ROE)
According to AM Best, the majority of market players reported high returns on equity in 2024, with an average rate for the industry as a whole of 15.7%.
Although this rate is lower than in 2023 (21.4%), it remains well above the ROE for the last decade. It is also well above the cost of capital for a large part of the industry.
All regions posted high results, mainly Europe, Asia, and Africa with respective rates of 16.9%, 15.7%, and 13%.
The excellent returns of reinsurers is accounted for by:
- continued positive technical results,
- recovery of unrealized investment losses in previous years thanks to higher interest rates,
- the relative decrease in the impact of natural disasters compared to previous years,
- solid capitalization, which allows for better absorption of claims and generates a return on equity.
Read also | Global reinsurers: combined ratio and ROE