 © DarrenRD , CC BY-SA 4.0 © DarrenRD , CC BY-SA 4.0 |
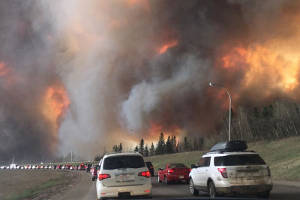
Spreading Alberta fire
Twenty four hours following the declaration of the Alberta fire [4] in the south east of Fort McMurray, the authorities reported 49 active fire blights, seven of which are completely beyond control. Two weeks later, 19 active fire blights, four of which completely beyond control, were reported in the entire province. The flames were fanned by hot dry weather and by winds gusting up to 40 kilometers per hour. Like many countries, Canada has been faced with one of the driest spring seasons ever in fifty years.
There was a total of 2000 fire fighters involved, assisted with 145 helicopters and 19 tanker aircrafts, entirely mobilized to counter the fires. The flames’ intensity died down only at the end of three weeks with the arrival of milder and more humid weather. By June 1, 2016, the fire was not completely under control. The blaze expanded to reach neighboring province of Saskatchewan, devastating 5 262 hectares of forests.
Forests fires were also spotted in the provinces of Ontario and British-Columbia. The fires have respectively consumed 78 062 hectares and 106 675 hectares in these areas.
Alberta fire, the economic impact
According to the initial estimates, the Fort McMurray fire is poised to be the most onerous in Canadian history. The impact evaluation of this disaster will not be finalized before several months, especially that the fires are not completely under control.
In a month’s time, more than 3000 homes and buildings were completely destroyed or damaged. Several residential neighborhoods were reduced to ashes while high value businesses and infrastructures were consumed by fire.
In view of the rapid advance of fires, several evacuations have been ordered in the region. In Total, nearly 100 000 inhabitants of Fort McMurray and neighboring villages had to abandon their homes quickly.
Moreover, the important sites of oil production belonging to the Canadian groups Syncrude and Suncor had to interrupt their operations. Oil extraction has, therefore, been reduced by half at 1.2 million barrels a day on average since the first week of May. This means future-lost earnings of nearly 765 million USD for the GDP of the region, that is, 0.33% of Alberta’s GDP and 0.06% of Canada’s GDP in 2016.
Analysts at the Bank of Montreal (BMO) reckon that the impact of the disaster on the national economy should be quite significant. The cost for the reconstruction of damaged properties, houses and other buildings should be comprised between 1.6 and 6.2 billion USD.
The total bill will include the damage caused directly to property, operating losses and costs pertaining to the disruption of the supply chain. [5]
Alberta fire, the cost for insurance
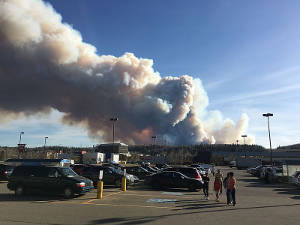 The fire started on May 1st, 2016 © Jason Woodhead, CC BY 2.0 The fire started on May 1st, 2016 © Jason Woodhead, CC BY 2.0 |
During the recent years, large-scale catastrophes have increased considerably in the region. The latest natural disasters [6] dates back to 2013 when heavy rain and flooding washed south Alberta.
These storms cost insurers 3.18 billion USD. Climate risks which used to cost 468 million USD a year in average prior to 2013, are now set at 766 million USD in annual average.
In 2018, that is two years after the fire in the province of Alberta, the insured losses amount at 2.9 billion USD to-date. This disaster is the most expensive in Canadian history.
In 2016, some analysts estimated the losses borne by insurers at 3.5 billion USD. Rating agencies were more pessimistic. A.M. Best estimated 10 billion USD. Standard & Poor's 5 billion USD while the Banque de Montréal expected a total cost of insured losses of 6.9 billion USD.
The major forest fires in Canada : 1985-June 2016
| Beginning date of the fire | Location | Number of evacuated people | Damaged surface | Total cost estimated in USD |
|---|---|---|---|---|
1 May 2016 | Fort McMurray, Alberta | 100 000 | 581 695 | 6,9 billion(*) |
June 2015 | North Saskatchewan | 15 000 | NA | NA |
1 June 2014 | British Columbia | 4 500 | 360 000 ha | 300 millions |
July 2013 | North Quebec | 450 | 350 000 ha | NA |
9 September 2012 | Peachland British Columbia | 1 550 | NA | |
May 2011 | Slave Lake, Alberta | 7000 | NA | 700 millions |
28 July 2010 | Williams Lake, Chilcotin, Houston, Burns Lake, Fraser Lake (British Columbia) | NA | 330 000 ha | 220 millions |
18 juillet 2009 | Kelowna, Kamloops and Cariboo (British Columbia) | 20 000 | 55 000 ha | 75 millions |
6 July 2006 | Cariboo-Chilcotin (British Columbia) | 871 | NA | NA |
3 July 2006 | Tumbler Ridge (British Columbia) | 4 000 | NA | NA |
1 July 2003 | South east of British Columbia and south west of Alberta | 48 501 | NA | 141 millions |
July 1994 | British Columbia | NA | 4169 ha | NA |
10 August 1998 | Salmon Arm (British Columbia) | 7 000 | 42115 ha | 3 millions |
1 August 1998 | British Columbia | 10 600 | 42 115 | 2795 |
May 1989 | North Manitoba | 25 000 | 2.5 millions ha | NA |
1 July 1985 | North east area of Vancouver (British Columbia) | NA | 240 000 ha | 68 millions |
* According to the bank of Montreal Source: Candadian database on catastrophes, http://bdc.securitepublique.gc.ca/
Number of fires and burnt surface in Canada : 1970-2014
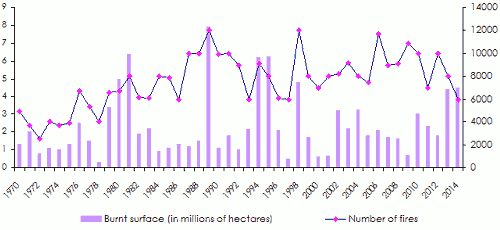 Source: National database on forest fires in Canada (BNDFFC)
Each year, Canada is up against nearly 8 000 forest fires, destroying in average more than 2.1 million hectares.
These disasters reoccur every year in spite of the preventive measures taken by the Canadian authorities to counter forest fires.
According to Canadian statistics, lightning is at the origin of 50% of the fires. It also accounts for 85% of the areas annually consumed by fire.
(1) National report on the situation of wild fires http://cwfis.cfs.nrcan.gc.ca/rapport
(2) ha: one hectare corresponds to 10 000 square meters
Read also: