Insurance status within the Ping An Group
 Over the past decade, the insurance turnover has grown very rapidly. This strong increase in premium volume is partly accounted for by the low insurance penetration rate in China, 3.9% in 2021 compared to 7% for the rest of the world.
New technologies are the second factor accelerating Ping An's growth. The Chinese conglomerate, which has significant technological tools, is contributing to the growth of the insurance industry in China, particularly in life class of business. Ping An Life, the group's main pillar, alone accounts for almost 40% of revenues, all activities combined.
Read also | Ping An Group structure
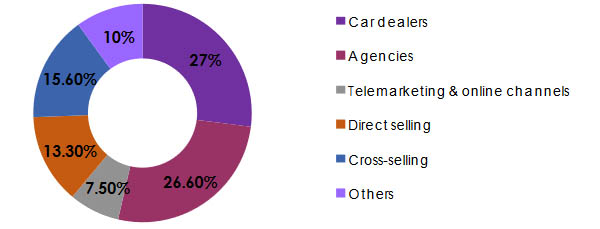
Insurance: Ping An distribution network
Ping An has a large distribution network, consisting mainly of general agents and bank branches. Call centers and cross selling are also used by the Chinese giant.
In non-life, the insurance distribution network is quite diversified with however a domination of car dealerships and agencies which collect respectively 27% and 26.6% of the total non-life premiums.
Ping An: the 2022 key indicators of insurance business
The insurance activity recorded a turnover of 769.633 billion CNY (111.12 billion USD) in 2022, that is, 63% of Ping An group total income. This activity also accounts for more than half of the group's net profit, that is, 8.407 billion USD.
In billions USD
| Life and non-life insurance | Banking activities | Asset management | Other activities | Group total | |||||
|---|---|---|---|---|---|---|---|---|---|
| Turnover | 111.12 | 63.01% | 40.673 | 23.07% | 8.344 | 4.73% | 16.202 | 9.19% | 176.339 |
| Net result | 8.407 | 54.20% | 6.572 | 42.37% | 0.549 | 3.54% | -0.016 | -0.10% | 15.512 |
| Shareholder’s equity | 61.333 | 49.47% | 31.19 | 25.97% | 16.913 | 13.64% | 13.539 | 10.92% | 123.975 |
| ROE | 13.71% | 21.07% | 3.25% | -0.12% | 12.51% | ||||
At the end of 2022, Ping An counted 122 million clients in its portfolio. This figure is continuously growing thanks to the intensive use of technological tools: online services, improvement of the customer experience, user loyalty, ...
Main life and non-life indicators in 2022
In billions USD
| 2022 | Premiums | Net result | Shareholder’s equity | ROE | Non-life combined ratio | Solvency margin | |
|---|---|---|---|---|---|---|---|
| Life insurance | 68.018 | 61.21% | 7.125 | 44.113 | 16.15% | - | 219.70% |
| Non-life insurance | 43.102 | 38.79% | 1. 282 | 17.219 | 7.44% | 100.20% | 220% |
| Total | 111.12 | 100% | 8.407 | 61.333 | 13.71% | 217.60% | |
Ping An: life and health insurance
Ping An develops its life and health activities through three entities: Ping An Life, Ping An Annuity and Ping An Health Insurance. In addition to life and health products, the group offers wealth management and retirement services.
In 2022, the life and health turnover amounted to 471.102 billion CNY (68.018 billion USD), down by 4% compared to 2021. It dropped from 64.44% in 2021 to 61.21% of the total group insurance. This activity marked a peak in 2019 with 65.87% of the total life and non-life.
Life and health premium evolution: 2012-2022
In billions USD
| Year | Individual insurance | Group insurance | Total life premiums | % life premiums / total premiums (1) | |||||
|---|---|---|---|---|---|---|---|---|---|
| CNY | USD | Parts | CNY | USD | Parts | CNY | USD | ||
| 2022 | 453.549 | 65.484 | 96.27% | 17.553 | 2.534 | 3.73% | 471.102 | 68.018 | 61.21% |
| 2021 | 470.214 | 73.776 | 95.91% | 20.076 | 3.15 | 4.09% | 490.29 | 76.926 | 64.44% |
| 2020 | 488.094 | 74.781 | 95.42% | 23.433 | 3.59 | 4.58% | 511.527 | 78.371 | 64.11% |
| 2019 | 503.828 | 72.098 | 96.21% | 19.845 | 2.84 | 3.79% | 523.673 | 74.938 | 65.87% |
| 2018 | 454.351 | 66.058 | 96.32% | 17.349 | 2.522 | 3.68% | 471.7 | 68.58 | 65.55% |
| 2017 | 373.139 | 57.296 | 96.01% | 15.503 | 2.38 | 3.99% | 388.642 | 59.676 | 64.23% |
| 2016 | 275.179 | 39.598 | 94.48% | 16.085 | 2.315 | 5.52% | 291.264 | 41.913 | 62.03% |
| 2015 | 208.364 | 32.102 | 93.83% | 13.693 | 2.11 | 6.17% | 222.057 | 34.212 | 57.53% |
| 2014 | 173.421 | 28.183 | 94.62% | 9.852 | 1.601 | 5.38% | 183.273 | 29.784 | 56.15% |
| 2013 | 145.517 | 23.801 | 94.88% | 7.86 | 1.285 | 5.12% | 153.377 | 25.086 | 57.01% |
| 2012 | 128.204 | 20.297 | 95.07% | 6.647 | 1.052 | 4.93% | 134.851 | 21.349 | 57.64% |
(1) Life and non-life insurance
Over the 2012-2022 period, the life business turnover has increased threefold. However, its contribution to Ping An's insurance portfolio has been declining over the past three years, from 65.85% in 2019 to 61.21% in 2022. In fact, in life, the group has been facing a series of challenges in recent years, including competition from other market players and weakening household purchasing power.
In addition to the general difficult context, the group has undertaken major reforms in its life distribution network, thus slowing down the underwriting process for new business.
The reforms are designed to:
- improve the management and distribution of products by general agents,
- speed up the diversification of distribution channels,
- strengthen digital operations nationwide,
- meet customers' wealth management, inheritance and retirement savings needs,
- modernize care management and services (Health management): home care for seniors and high-end senior care,
- improve competitiveness,
- modernize products.
Ping An: Non-life insurance
Non-life insurance is the responsibility of Ping An Property & Casualty (Ping An P&C). This entity covers all non-life, personal and corporate risks, all non-life classes of business including health.
During the 2012-2022 period, non-life insurance has developed at a stable growth rate, with the exception of a quasi-stagnation period in 2016 and a slight decline in 2021. In the end, the non-life class of business has grown 2.75 times over the past 10 years, compared with the 3.20 times growth of the life business over the same period.
In 2022, non-life premiums have increased by 10.3% to reach 298.531 billion CNY (43.102 billion USD) in local currency.
It is worth noting that over the last 10 years, the contribution of the non-life class of business in the total of group insurance (life and non-life) has been decreasing both in terms of premiums which went from 42.36% in 2012 to 38.79% in 2022. It has also declined in terms of the overall result which represented 41.86% of the one achieved by the group in 2012 versus only 15.25% in 2022.
Premium and result evolution: 2012-2022
In billions USD
| Year | Non-life premiums | Net non-life result | ||||
|---|---|---|---|---|---|---|
| CNY | USD | In % of the total premiums (1) | CNY | USD | In % of the total result (1) | |
| 2022 | 298.531 | 43.102 | 38.79% | 8.879 | 1.282 | 15.25% |
| 2021 | 270.553 | 42.45 | 35.56% | 16.192 | 2.541 | 21.17% |
| 2020 | 286.353 | 43.872 | 35.89% | 16.159 | 2.476 | 14.40% |
| 2019 | 271.391 | 38.836 | 34.13% | 22.808 | 3.264 | 18.02% |
| 2018 | 247.856 | 36.036 | 34.45% | 12.274 | 1.784 | 17.28% |
| 2017 | 216.393 | 33.227 | 35.77% | 13.372 | 2.053 | 27.01% |
| 2016 | 178.291 | 25.656 | 37.97% | 12.7 | 1.828 | 33.66% |
| 2015 | 163.955 | 25.261 | 42.47% | 12.65 | 1.949 | 37.37% |
| 2014 | 143.15 | 23.263 | 43.85% | 8.817 | 1.433 | 33.60% |
| 2013 | 115.674 | 18.92 | 42.99% | 5.841 | 0.955 | 30.66% |
| 2012 | 99.089 | 15.688 | 42.36% | 4.648 | 0.736 | 41.86% |
(1) Group’s total life and non-life insurance
Evolution of the 2012-2022 technical ratios
An analysis of Ping An P&C's claims experience over the last decade has exhibited a clear deterioration in the loss ratio, which has dropped by 10 points in 10 years, going from 59.4% in 2012 up to 69.8% in 2022. This rate has been heavily impacted by the poor performance of the credit class of business in 2022 whose loss ratio has deteriorated by 44 points in one year.
This deterioration in the loss ratio weighed on the combined ratio, which fell by 5 points in 10 years and exceeded the 100% mark for the first time in 2022, despite a clear improvement in the management expense ratio at (+5%).
In billion USD
| Year | Net earned premiums | Net incurred losses | Net loss ratio | Net management expenses ratio | Net combined ratio | ||
|---|---|---|---|---|---|---|---|
| CNY | USD | CNY | USD | ||||
| 2022 | 277.62 | 40.083 | 193.898 | 27.995 | 69.80% | 30.40% | 100.20% |
| 2021 | 260.49 | 40.871 | 174.769 | 27.421 | 67.10% | 31.00% | 98.10% |
| 2020 | 253.017 | 38.765 | 153.177 | 23.468 | 60.50% | 38.60% | 99.10% |
| 2019 | 231.403 | 33.114 | 132.615 | 18.977 | 57.30% | 39.10% | 96.40% |
| 2018 | 211.918 | 30.811 | 116.305 | 16.91 | 54.90% | 41.10% | 96.00% |
| 2017 | 188.219 | 28.901 | 106.474 | 16.349 | 56.60% | 39.60% | 96.20% |
| 2016 | 153.345 | 22.066 | 83.398 | 12.001 | 54.40% | 41.50% | 95.90% |
| 2015 | 134.219 | 20.679 | 76.137 | 11.73 | 56.70% | 38.90% | 95.60% |
| 2014 | 109.61 | 17.813 | 63.172 | 10.266 | 57.60% | 37.60% | 95.20% |
| 2013 | 91.28 | 14.93 | 55.15 | 9.02 | 60.40% | 36.90% | 97.30% |
| 2012 | 79.116 | 12.526 | 47.009 | 7.442 | 59.40% | 35.90% | 95.30% |
Non-life 2022 premium breakdown
The portfolio is overwhelmingly dominated by the motor class of business, which alone accounts for 67.43% of non-life premiums. It is worth noting that credit and bond insurance ranks in third place, well ahead of health, personal accident and third-party liability.
The credit and bond loss experience and the high level of management costs in the third-party liability classes of business are weighing on the combined ratio, all activities combined, which reached 100.2% in 2022.
Non-life premiums and technical ratios in 2022
In billions USD
| Classes of business | Premiums | Net earned premiums | Net incurred losses | Net loss ratio | Net combined ratio | |
|---|---|---|---|---|---|---|
| En USD | % | |||||
| Motor | 29.062 | 67.43% | 27.321 | 18.816 | 68.87% | 95.80% |
| Credit-bond | 3.167 | 7.35% | 4.138 | 4.723 | 114.12% | 131.40% |
| Third party liability | 3.145 | 7.30% | 2.502 | 1.533 | 61.26% | 105.40% |
| Personal accident | 2.02 | 4.69% | 2.235 | 0.983 | 43.98% | 94.50% |
| Health | 1.4 | 3.25% | 1.206 | 0.517 | 42.86% | 95.50% |
| Property damage (1) | 4.308 | 10% | 2.679 | 1.424 | 53.13% | - |
| Non-life total | 43.102 | 100% | 40.083 | 27.995 | 69.84% | 100.20% |
(1) Fire and technical risks