Reinsurance treaties: The 2017 Renewal
 |
The insurers-reinsurers talks get started in September with the traditional Monte Carlo meeting and continue with the regional conferences and meetings.
These talks provide attending actors reasons for concern or hope. The companies' loss experience, the capacities supplied, the reinsurers’ soundness and the concentration intentions are the traditional determinants of major trends, in addition to elements that are exogenous to the relevant markets such as loss experience at the global level, especially that pertaining to natural catastrophes, the inflow of alternative capital into reinsurance, the financial environment. So many criteria having direct impact on supply and on reinsurance terms for the upcoming renewal.
Reinsurance's turnover evolution
Since 2014, the overall turnover of the insurance and reinsurance industry has apparently been running out of steam, with direct premiums at the global level declining from 4 754 billion USD in 2014 to 4 553 billion USD in 2015, a 4.2% decrease in one year. At the same time, reinsurance premiums have also gone down from 245 billion USD in 2014 to 240 billion USD in 2015, that is a decrease of 2%.
Evolution of the world insurance turnover: 2005-2015
in billions USD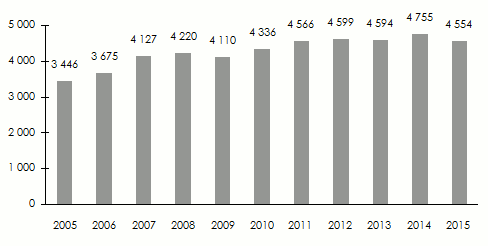
Evolution of the world reinsurance turnover: 2005-2015
in billions USD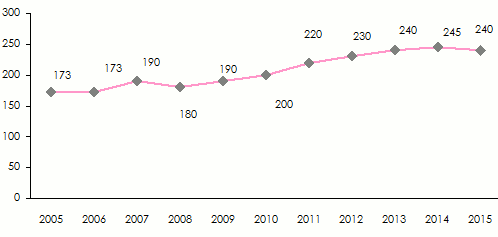 Sources: Sigma, Swiss Re
 The shrinking of premiums has been partially accounted for by the global crisis that does not foster the market. In such a context, insurance demand is impacted by declining purchasing power of individuals, the fall of insured values and the lack of corporate perspectives. Reinsurance, on its turn, is suffering not only from the decrease in insurable material but also from the increase of the capacities supplied to ceding companies, especially those introduced by alternative capital in search for return. By pulling prices downwards, competition among insurers on the one hand, and among reinsurers, on the other hand, has contributed considerably to the sector’s stagnation.
The evolution of reinsurance premiums
The premium rates of non proportional reinsurance treaties are affected by the loss experience of natural catastrophes (cyclones, floods, earthquakes), which, for instance, witnessed an upsurge in 1992 with hurricane Andrew and reached a low in 2000. The rates supplied by reinsurers have been on the rise, backed up by a succession of events, the 9/11 attacks, hurricane Katrina, Rita and Wilma in 2005 then Ike in 2008 and the earthquake in Japan, along with the 2011 tsunami.
Catastrophe claims 1990-2015
in billions USD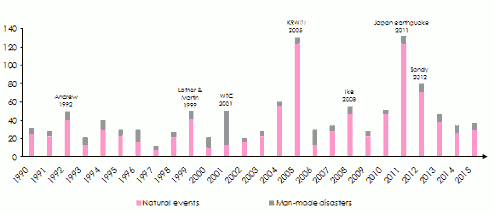 (1) Hurricanes Katrina, Rita, Wilma Sources: Sigma, Swiss Re
 Ever since, the global index of the non-proportional reinsurance programs, calculated by Guy Carpenter, has shown a notable decrease in the rates. Abundant capacities are contributing to the decrease of the prices for the coverage of natural disasters. In this area, rate decrease is of 9% for the last 2016 renewal.
Decrease of global pricing since the mid 2000s
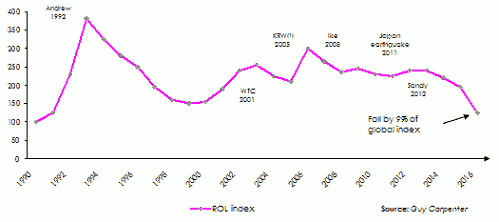 (1) Hurricanes Katrina, Rita, Wilma Source: Guy Carpenter
Since 2012, this decline is more significant in some regions than others, particularly in Asia-Pacific and the United States.
Decrease according to the different regions
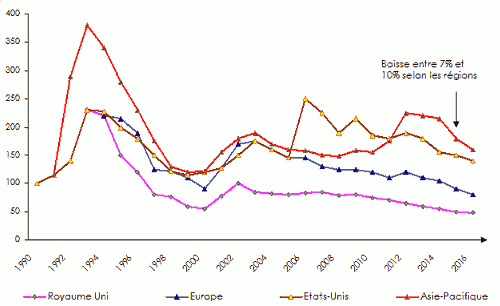 Source: Guy Carpenter
The supply of reinsurance capacity on the eve of the 2017 renewal
According to Aon Benfield, the reinsurers’ overall capacity has grown by 4% during the last renewal, setting a new record at 585 billion USD by June 30, 2016. This figure includes the amount of alternative capital and stands as an approximate measure of the sums available, to meet insurers and reinsurers’ coverage needs. Since 2008, reinsurers’ capacity has increased by more than 70%.
Evolution of reinsurers’ global capacity (2007-2016)
in billions USD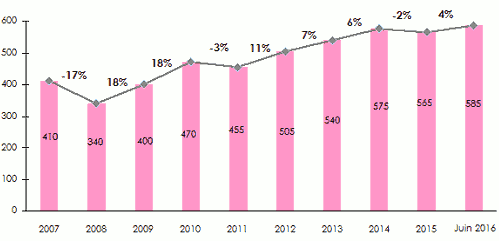 Source: Aon Benfield Analytics
 Alternative reinsurance capacity
Even though this kind of reinsurance applies only to the coverage of natural catastrophes in the United States and Asia, the inflow of alternative capital partially accounts for the decline of traditional reinsurance premiums.
Since 2008, alternative reinsurance supply has more than doubled going from 8% up to 19% of the overall capacities underwritten during the last renewal.
Alternative capacity in % of global limits of catastrophe reinsurance
Proportion of alternative capacity (%)
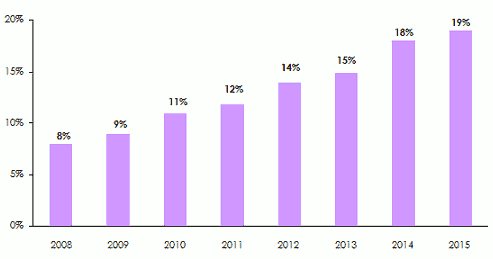 Source: Guy Carpenter
 The technical results of the reinsurance market (1990-2015)
Since 2003, and with the exception of the years 2005 and 2011, strongly impacted by natural catastrophes, reinsurers’ results have been improving considerably. Paradoxically, the 2008 and 2009 financial crisis has hardly had any impact on reinsurers who posted combined ratios among the lowest in the last fifteen years.
Following the 2011 peak, the improvement tendency characterizing results has been consolidated. The current economic crisis has compelled reinsurers to focus on their operating results.
Evolution of combined ratios: 1990-2015
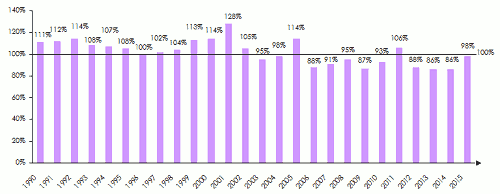 Source: S&P Global Reinsurance Highlights
 The effects of a low-interest rate environment
Interest rates have been on a falling curve since the end of 2007. The environment of low interest rates that is prevailing today is having drastic repercussions on traditional reinsurers whose massive investments are mostly guided toward cash deposits and treasury bonds. The consequences of such a situation will play out as follows:
- a decrease in return on investments of about 40%,
- investments in riskiest assets in order to obtain a better return on investments,
- inflated levels of capital as a result to non-achieved profits,
- attraction of investors to insurance and reinsurance which remain interesting investments, in comparison with other financial markets,
- an improvement of the technical profitability of insurance portfolios,
- funding by recourse to more affordable debts.
Turnover of major reinsurers
The twenty most important reinsurers underwrote 184.4 billion USD of premiums by the end of 2015, that is 76% of the overall global premiums.
Premiums of the top 20 reinsurers in 2015
in billions USD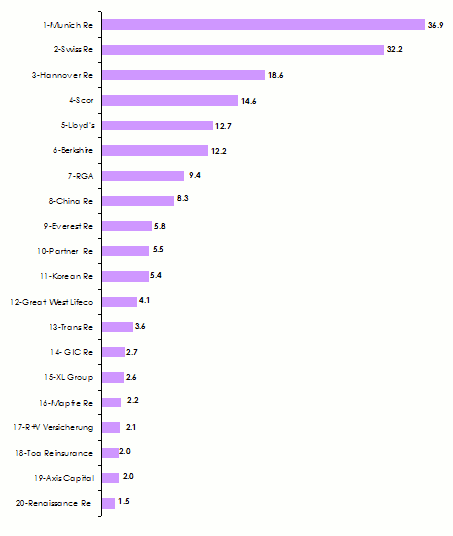 Source: AM Best and companies’ reports
Evolution of loss experience 2012-2016
Natural catastrophes claims
It is noted that in the course of the last 30 years, the number of claims triggered by natural events has been steadily rising. In 2015, the number of claims reported is higher, yet their intensity is lower. This loss experience is equal to the mean value of the 20 recent years.
The economic damage triggered by natural catastrophes amounted to 100 billion USD in 2015, compared to 110 billion USD in 2014, 138 billion USD in 2013 and 173 billion USD in 2012. The first six months of the year 2016, have reported an increase in the frequency and intensity of natural catastrophes with several major events costing more than 1 billion USD.
Natural catastrophes’ claims in 2015
costs in billions USD| 2015 | 2014 | 2013 | 2012 | 10 years average | 30 years average | |
|---|---|---|---|---|---|---|
Number of events | 1060 | 980 | 880 | 920 | 870 | 670 |
Economic cost | 100 | 110 | 138 | 173 | 192 | 130 |
Insured cost | 30 (30%) | 35 (32%) | 44 (32%) | 65 (38%) | 56 (29%) | 34 (26%) |
Number of victims | 23 000 | 13 000 | 20 000 | 10 000 | 68 000 | 54 000 |
Major world natural events in 2016
costs in billions USD| Kind of event | Country or affected area | Insured cost | |
|---|---|---|---|
| March | Hailstorm | United States | 1,1 |
| April | Earthquake | Japan | 4 |
| April | Hailstorm | Texas, United States | 3 |
| May | Fire forest | Canada | 4 |
| May | Elvira storm | Germany, excluding France floods | 1.5 |
| June | Floods | France | 1.2 |
Man-made disasters
Nearly ten claims worth more than 200 million USD were caused by man in 2015; with sums comprised between 3 and 6 billion USD, the Tianjin harbor explosion stands as the major event of the last 24 months.
Major claims in 2015 (Claims of more than 200 million USD of insured losses)
in millions USD| Nature of the event | Country or area affected | Insured losses | |
|---|---|---|---|
| February | Explosion on an oil platform BW Offshore | Brazil | 370-470 |
| March | Crash of a plane owned by Germanwings | Alpes-de-Haute-Provence, France | 300 |
| April | Fire on an oil platform of the Mexican company Pemex | Gulf of Mexico | 670-780 |
| May | Loss of Mexsat 1 satellite | Mexico | 390 |
| June | Incident when displacing the Bigfoot Chevron offshore platform | Gulf of Mexico | 350-500 |
| August | Explosion in a chemical warehouse at Tianjin Harbor | Tianjin, China | 3000-6 000 |
| August | Explosion in a refinery warehouse of the Czech oil group Unipetrol | Czech Republic | 390 |
| November | Dam failure of the iron mine of Samarco | Brazil | 450 |
| November | Crash of a Russian Airbus | Russia | 250 |
Major claims in 2016 (Claims of more than 200 million USD of insured losses)
in millions USD| Nature of the event | Country or are affected | Insured losses | |
|---|---|---|---|
| March | Loss of equipment at Stena Drilling station | Canada | 225 |
| April | Breakdown of the FPSO Kwame Nkrumah oil platform | Ghana | 1700 |
Profitability of the reinsurance companies
 |
According to rating agencies, the conditions are favourable for the falling profitability of reinsurers noted in 2015 and 2016 to continue in 2017. The expected decline is certainly less than in 2016, but enough for some players to be affected, thus paving the way for future mergers or acquisitions. Medium-size reinsurers, those least diversified, or those operating in markets where tariff levels are not good enough to cover cost in capital, are the most exposed. The balance between solvency, profitability and growth are so difficult to obtain that the players end up being highly capitalized. S&P is expecting ROE of average market comprised between 7% and 9% in 2016 and in 2017. For some specialists, the market will not react vigorously unless return on equity is below 5%, which predicts a soft market for still many years to come.
The average combined ratios will be comprised between 97% and 102% in 2016, but will exceed 100% in 2017. Portfolio risk selection will be paramount in addressing this trend for the upcoming years. Equally fundamental is the selection of the geographic zones of activity and the diversification of life reinsurance.
Finally, with the theatrical comeback of proportional treaties designed to address the loss of income of the excess loss treaties, tariff decrease will probably be less notable than in 2016, especially in non life reinsurance where a premium decline comprised between 0% and 5% may be predicted. The soft cycle is, therefore, poised to last much longer than expected.
Related articles: