
The region-based analysis covers six entities or markets, namely Continental Europe, Lloyd's, the Americas, Asia-Pacific, the Middle East, and Africa.
Europe, which has five market leaders, namely Munich Re, Swiss Re, Hannover Re, Lloyd's and SCOR, remains the world's leading reinsurance market in 2024 with 45.5% of underwriting, or 179.784 billion USD. While this continent controlled 56.5% of global reinsurance in 2015, its market share has continued to decline year on year.
Conversely, reinsurers based in the Americas continue to gain ground. Their market share rose from 30.2% in 2015 to 43.4% in 2024, an increase of 13.2 points in ten years.
The remaining 11.1% is divided between Asia (9.1%), Africa (1.6%), and the Middle East (0.4%), confirming the dominance of the European and American markets.
Figures in millions USD
| Region | 2015 | 2019 | 2023 | 2024 | Δ 2023-2024 | 2024% |
| Europe | 121 586 | 159 598 | 176 553 | 179 784 | 2% | 45.5% |
| Americas | 64 934 | 100 774 | 155 193 | 171 296 | 10% | 43.4% |
| Asia | 24 386 | 42 736 | 36 001 | 35 871 | 0% | 9.1% |
| Africa | 3 320 | 5 054 | 5 763 | 6 269 | 9% | 1.6% |
| Middle East | 787 | 842 | 1 203 | 1 474 | 23% | 0.4% |
| Total | 215 013 | 309 004 | 374 713 | 394 694 | 5% | 100% |
Source: Atlas Magazine
European reinsurers
Europe, excluding Lloyd's of London, is the world's leading reinsurance market with a market share of 39.6% in 2024, a share that went down 11 points compared to 2015.
Despite its relative decline, continental Europe remains a strong reinsurance market in 2024. It also remains highly concentrated, with four major groups, namely Munich Re, Swiss Re, Hannover Re, and SCOR, accounting for 78.6% of the region's underwriting. These groups have demonstrated historical stability due to the strong diversification of their portfolios and their significant capacities.
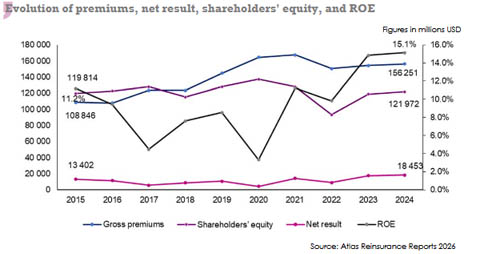
Most European reinsurers have, overall, improved their profitability. In 2024, the region's net result stood at 18.4 billion USD and ROE at 15.1%. The combined ratio has also improved to 86.4%.
Figures in millions USD
| 2015 | 2019 | 2022 | 2023 | 2024 | Δ 2015-2024 (1) | |
| Gross premiums | 108 846 | 144 622 | 150 500 | 154 481 | 156 251 | 4.1% |
| Share capital | 13 363 | 15 182 | 15 468 | 15 714 | 14 947 | 1.3% |
| Shareholders’ equity | 119 814 | 127 977 | 93 413 | 118 873 | 121 972 | 0.2% |
| Net result | 13 402 | 10 933 | 9 194 | 17 637 | 18 453 | 3.6% |
| ROE (2) | 11.2% | 8.5% | 9.8% | 14.8% | 15.1% | 3.4% |
| Combined ratio IFRS17 (3) | 91.80% | 99.00% | 90.8% | 87.60% | 86.40% | - |
(1) Average annual growth rate
(2) Source: AM Best
(3) Source: AM Best, ratios of the main life reinsurers according to IFRS4 for 2015 and 2019. Combined ratios for 2023 and 2024 of life reinsurers who adopted the IFRS17 (Munich Re, Hannover Re, Swiss RE and SCOR).
Lloyd’s
Lloyd's holds a central position in the global reinsurance market, standing out for the dynamism of its syndicates and its unique organizational structure, which sets it apart from traditional reinsurers. This player is particularly known for:
- coverage of complex and specialty risks (marine, aviation, energy),
- a unique distribution model,
- technical discipline.
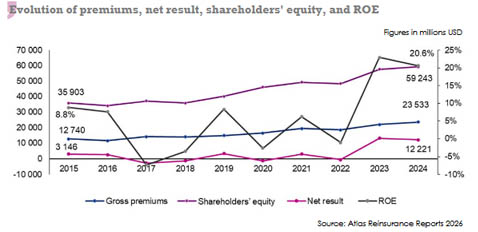
For 2024, Lloyd's reinsurance turnover stood at 23.533 billion USD, representing 6% of global premiums.
During the 2015-2024 period, Lloyd's reported average annual premium growth of 7.1%, well above that of the leading European reinsurers. Over the same period, its equity capital jumped 16.3%.
The 2024 ROE was 20.6%, which is higher than the global rate (15.7%) and the rates in other regions: 15.1% in Europe, 4.2% in the Americas, and 15.7% in Asia.
The loss ratio and combined ratio for 2024 stood at 52.5% and 86.9% respectively, slightly up in 2023.
Figures in millions USD
| 2015 | 2019 | 2022 | 2023 | 2024 | Δ 2015-2024 (1) | |
| Gross premiums | 12 740 | 14 976 | 18 527 | 22 072 | 23 533 | 5.7% |
| Share capital | 26 445 | 36 194 | 41 165 | 40 603 | 38 324 | 4.2% |
| Shareholders’ equity | 35 903 | 40 185 | 48 480 | 57 629 | 59 243 | 16.3% |
| Net result | 3 146 | 3 321 | -517 | 13 217 | 12 221 | 9.9% |
| ROE | 8.8% | 8.3% | -1.1% | 22.9% | 20.6% | 0.6% |
| Loss ratio | 49.90% | 63.40% | 57.5% | 49.6% | 52.5% | - |
| Combined ratio | 90% | 102.10% | 91.9% | 84.0% | 86.9% | - |
(1) Average annual growth rate
Source: Lloyd’s
The American reinsurance market
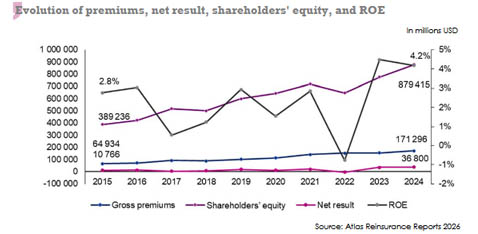
According to data published by Atlas Reinsurance Reports (1), the underwriting results of the 52 reinsurers based in the Americas improved in 2024. The market performed significantly better than in 2023, with premiums up 10.4%, equity up 13.3% and net income up 5.8%.
This progress reflects stricter underwriting discipline, a targeted reduction in exposure to certain risks, stronger reserves, and improved financial income.
Even against a backdrop of persistently high natural catastrophe losses, reinsurers in the Americas and Bermuda managed to maintain good technical profitability, with a combined ratio of 89.5% in 2024.
As a reminder, 2024 was marked by an increase in insured losses amounting to 137 billion USD related to natural disasters. This heavy toll was mainly due to Hurricanes Helene and Milton and convective storms in the United States.
Key indicators: 2015-2024
Figures in millions USD
| 2015 | 2019 | 2022 | 2023 | 2024 | Δ 2015-2024 (1) | |
| Gross premiums | 64 934 | 100 774 | 151 843 | 155 193 | 171 296 | 11.4% |
| Share capital | 112 848 | 87 146 | 105 835 | 113 971 | 113 728 | 0.1% |
| Shareholders’ equity | 389 236 | 599 645 | 648 292 | 776 000 | 879 415 | 9.5% |
| Net result | 10 766 | 17 621 | -5 001 | 34 783 | 36 800 | 14.6% |
| ROE | 2.8% | 2.9% | -0.8% | 4.5% | 4.2% | 4.7% |
| Loss ratio (2) | 55.4% | 65.1% | 63.9% | 56.4% | 61.4% | - |
| Combined ratio (2) | 88.6% | 96.9% | 91.4% | 85.1% | 89.5% | - |
(1) Average annual growth rate
(2) Source: AM Best for the loss ratio and combined ratio, and Atlas Reinsurance Reports 2026 for other data.
The Asia-Pacific reinsurance market
The Asian reinsurance market is evolving in a favorable environment, driven by the growth of direct insurance, product diversification, innovation, and increased demand for coverage, mainly in health insurance for individuals and cyber and specialty risks for businesses.
This increase in demand is particularly stimulated by demographic changes, urbanization, the rise of the middle class, infrastructure development, and industrial growth.
In this context, reinsurers provide technical expertise, appropriate pricing, and support for growth.
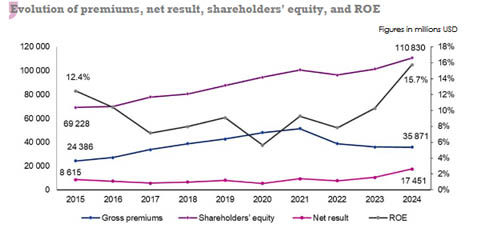
The Asian market is certainly attractive but highly competitive. It has 23 reinsurers with total premiums of 35.871 billion USD in 2024. The top ten players account for 92.5% of underwriting results. China Re, the regional leader, alone holds a 21.3% market share.
Despite high exposure to natural disasters, pressure on rates, and inadequate capitalization for certain risks, market profitability improved in 2024.
Thanks to underwriting discipline and high investment income, the region's average ROE reached its highest level since 2015 in 2024, at 15.7%.
The combined ratio also improved to 91.4%, the lowest rate in the last ten years.
Key indicators: 2015-2024
Figures in millions USD
| 2015 | 2019 | 2022 | 2023 | 2024 | Δ 2015-2024 (1) | |
| Turnover | 24 386 | 42 736 | 38 877 | 36 001 | 35 871 | 4.4% |
| Global market share | 11.3% | 13.8% | 10.6% | 9.6% | 9.1% | -2.4% |
| Share capital | 24 569 | 24 158 | 26 100 | 25 554 | 25 965 | 0.6% |
| Shareholders' equity | 69 228 | 87 614 | 96 391 | 101 539 | 110 830 | 5.4% |
| Net result | 8 615 | 7 978 | 7 551 | 10 435 | 17 451 | 8.2% |
| ROE | 12.4% | 9.1% | 7.8% | 10.3% | 15.7% | 2.6% |
| Loss ratio (2) | NA | 73.4% | 75% | - | - | - |
| Combined ratio (2) | NA | 100.9% | 100.3% | - | - | - |
| Combined ratio IFRS17 (2) | - | - | 95.8% | 92.5% | 91.4% | - |
(1) Average annual growth rate
(2) Source: AM Best for the loss ratio and combined ratio
NA: not available
Read also | Top 10 reinsurers in the Asia-Pacific region
The African reinsurance market
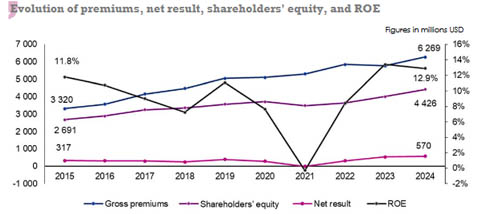
The African reinsurance market has significant growth potential. All players in this market, 48 reinsurers studied out of a total of 51, generated 6.269 billion USD in premiums in 2024, representing growth of 8.8% compared to 2023. This amount accounts for 1.6% of the global reinsurance market.
Share capital, equity, and net result improved in 2024, increasing by 9.7%, 10.4%, and 5.9%, respectively. Only ROE declined, falling from 13.4% in 2023 to 12.9% in 2024.
Even with improved indicators, African reinsurance remains vulnerable. It has been operating in a difficult economic environment marked by persistent inflation, rising public debt, and volatile local currencies. Most countries have very low insurance penetration rates.
These difficulties are compounded by an extremely heterogeneous regulatory landscape, which complicates regional integration and slows the rise of local players. In many countries, capacity remains low, forcing insurers to turn to international markets, particularly for industrial, energy, and catastrophe risks.
Despite its structural and economic weaknesses, reinsurance retains significant growth drivers, thanks in particular to:
- population growth and the rise of the middle class,
- rapid urbanization and the development of major infrastructure projects, which are boosting demand for insurance and reinsurance,
- the growth of insurtech and parametric products, which make it possible to reach previously uninsured populations,
- public policies aimed at strengthening local capacities, such as in Kenya, where the government plans to increase the legal cession rate to Kenya Re from the current 20% to 25% in January 2026, or regulatory initiatives relating to Takaful in North Africa.
Key indicators: 2015-2024
Figures in millions USD
| 2015 | 2019 | 2021 | 2022 | 2023 | 2024 | Δ 2023-2024 | Δ 2015-2024 (1) | |
| Gross premiums | 3 320 | 5 054 | 5 294 | 5 848 | 5 763 | 6 269 | 8.8% | 7.3% |
| Global market share | 1.5% | 1.6% | 1.4% | 1.6% | 1.5% | 1.6% | 6.7% | 0.7% |
| Share capital | 1 051 | 1 279 | 1 535 | 1 669 | 1 665 | 1 826 | 9.7% | 6.3% |
| Shareholders’ equity | 2 691 | 3 571 | 3 491 | 3 641 | 4 011 | 4 427 | 10.4% | 5.7% |
| Net result | 317 | 395 | -10 | 307 | 538 | 570 | 5.9% | 6.7% |
| ROE | 11.8% | 11.0% | -0.3% | 8.4% | 13.4% | 12.9% | -3.7% | 1.0% |
(1) Average annual growth rate
Source: Atlas Reinsurance Reports 2026
Main African reinsurance markets
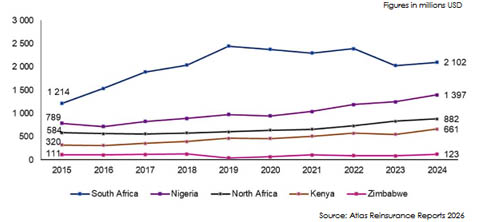
With 2.102 billion USD in premiums in 2024, South Africa dominates African reinsurance. This country has seven players accounting for 34% of underwriting. It is followed by Nigeria (1) and North Africa (2), which capture 22% and 14% of the continent's premiums, respectively. With six players, Kenya ranks fourth in the market, reporting 661 million USD in premiums in 2024.
The reinsurance market in the Middle East
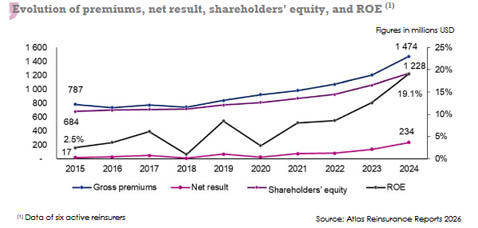
The Middle East reinsurance market faces challenges related to an increase in natural disasters, geopolitical tensions, oil price volatility, and high inflation.
Despite this difficult environment, players in the region performed well in 2024. Total turnover grew by 22.5% compared to 2023, the highest increase among the other regions under study. During the same period, share capital, equity, and net result also saw remarkable growth of 20.1%, 15.6%, and 74.6%, respectively. ROE soared to 19.1% in 2024, compared with 12.6% in 2023 and 2.5% in 2015.
It is worth noting that the region has abundant capacity from local players as well as from major international reinsurers. The market is also supported by the implementation of mega infrastructure projects in the Gulf countries, rising rates in the property and casualty lines, and the gradual introduction of statutory cession, particularly in Saudi Arabia, where it rose from 20% in 2022 to 25% in 2024 and 30% in 2025.
Key indicators: 2015-2024
Figures in millions USD
| 2015 | 2019 | 2021 | 2022 | 2023 | 2024 | Δ 2015-2024 (1) | |
| Gross premiums of six reinsurers (2) | 787 | 842 | 984 | 1 073 | 1 204 | 1 474 | 7.2% |
| Market premiums (3) | 1 886 | 1 658 | 1 042 | 1 209 | - | - | - |
| Share capital | 555 | 526 | 576 | 581 | 588 | 706 | 2.7% |
| Shareholders’ equity | 684 | 774 | 871 | 927 | 1 062 | 1 228 | 6.7% |
| Net result | 17 | 65 | 71 | 80 | 134 | 234 | 33.8% |
| ROE | 2.5% | 8.4% | 8.2% | 8.6% | 12.6% | 19.1% | 25.4% |
(1) Average annual growth rate
(2) Premiums of the six reinsurers in operation from 2015 to 2024
(3) Overall market premiums, or 13 reinsurers, including those that have ceased operations
Source: Atlas Reinsurance Reports 2026
Reinsurer-based analysis
In 2024, the Middle East reinsurance market has six players. Saudi Re is the regional leader with 627.7 million USD in premiums and a 42.6% market share. The Saudi reinsurer is followed by Kuwait Re and Hannover ReTakaful with respective shares of 17.6% and 15.3%.
Noteworthy is the buoyancy exhibited by Saudi Re and Oman Re, which posted the strongest growth in the region, with +47% for the former and +22% for the latter.
Read also | Ranking of reinsurers in the Middle East