Marché de l'assurance en Arabie Saoudite : chiffre d'affaires 2016
Marché de l'assurance en Arabie Saoudite : classement 2016 des sociétés selon le chiffre d'affaires(1)
en milliers| Chiffre d’affaires 2016 | Chiffre d’affaires 2015 | Parts 2016 | Evolution 2016-2015 (3) | |||
|---|---|---|---|---|---|---|
| En SAR(2) | En USD | En SAR(2) | En USD | |||
Tawuniya | 8 055 135 | 2 148 627 | 7 545 268 | 2 011 946 | 22,5% | 6,8% |
Bupa Arabia | 7 938 630 | 2 117 550 | 7 328 016 | 1 954 015 | 22,2% | 8,3% |
Medgulf | 3 194 334 | 852 057 | 4 001 934 | 1 067 116 | 8,9% | -20,2% |
Malath Insurance | 2 167 856 | 578 254 | 1 863 478 | 496 896 | 6,1% | 16,3% |
Al Rajhi Takaful | 1 948 650 | 519 783 | 1 361 890 | 363 148 | 5,4% | 43,1% |
AXA Cooperative | 1 153 974 | 307 811 | 1 128 176 | 300 828 | 3,2% | 2,3% |
Walaa | 1 016 608 | 271 170 | 752 993 | 200 786 | 2,8% | 35,0% |
Trade Union | 954 483 | 254 599 | 845 982 | 225 581 | 2,7% | 12,8% |
Allianz Saudi Franzi | 836 272 | 223 067 | 803 213 | 214 177 | 2,4% | 4,1% |
United Cooperative Assurance (UCA) | 819 595 | 218 619 | 1 271 736 | 339 108 | 2,3% | -35,6% |
SAICO | 801 806 | 213 874 | 888 221 | 236 844 | 2,2% | -9,7% |
Arabian Shield | 754 470 | 201 247 | 531 176 | 141 638 | 2,1% | 42,0% |
Salama | 571 353 | 152 403 | 391 740 | 104 457 | 1,6% | 45,9% |
WAFA Insurance(4) | 550 807 | 146 922 | 521 698 | 139 111 | 1,5% | 5,6% |
Allied Cooperative Insurance Group (ACIG) | 510 618 | 136 202 | 549 441 | 146 508 | 1,4% | -7,1% |
Wataniya | 507 708 | 135 426 | 518 709 | 138 314 | 1,4% | -2,1% |
Buruj | 437 565 | 116 716 | 446 993 | 119 191 | 1,2% | -2,1% |
Arabia Insurance Cooperative (AICC) | 419 101 | 111 791 | 653 947 | 174 375 | 1,2% | -35,9% |
ATC Alahli Takaful | 356 279 | 95 034 | 361 048 | 96 273 | 1,0% | -1,3% |
Alinma Tokio M | 321 888 | 85 860 | 220 357 | 58 758 | 0,9% | 46,1% |
Al Alamiya | 310 751 | 82 890 | 402 032 | 107 202 | 0,9% | -22,7% |
Gulf Union | 277 376 | 73 987 | 224 925 | 59 976 | 0,8% | 23,3% |
Solidarity | 262 447 | 70 005 | 303 406 | 80 903 | 0,7% | -13,5% |
Gulf General | 255 152 | 68 059 | 351 946 | 93 846 | 0,7% | -27,5% |
SABB Takaful | 217 464 | 58 006 | 228 595 | 60 955 | 0,6% | -4,9% |
Chubb Arabia Cooperative Insurance | 214 837 | 57 306 | 268 746 | 71 661 | 0,6% | -20,1% |
Metlife AIG ANB | 208 090 | 55 506 | 144 741 | 38 595 | 0,6% | 43,8% |
Sagr Insurance | 176 014 | 46 950 | 863 838 | 230 342 | 0,5% | -79,6% |
Amana Insurance | 169 866 | 45 310 | 414 019 | 110 398 | 0,5% | -59,0% |
Al-Ahlia Insurance | 167 142 | 44 583 | 259 662 | 69 239 | 0,5% | -35,6% |
Saudi Enaya | 128 825 | 34 363 | 70 933 | 18 914 | 0,4% | 81,6% |
Al Jazira Takaful Taawuni | 76 166 | 20 317 | 71 148 | 18 972 | 0,2% | 7,1% |
Sanad | 126 | 34 | 48 | 13 | 0,0% | 162,5% |
Weqaya Takaful | - | - | 2 419 | 645 | 0,0% | -100,0% |
Total | 35 781 388 | 9 544 327 | 35 592 474 | 9 490 733 | 100,0% | 0,5% |
(2) Riyal saoudien
(3) Taux de croissance en monnaie locale
(4) Ex Saudi Indian Company for Cooperative Insurance
Parts de marché des dix premières compagnies en 2016
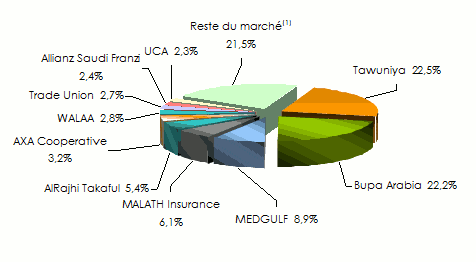 (1) 24 compagnies
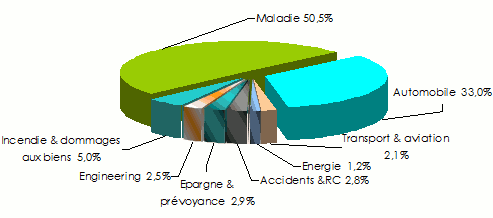
Marché de l'assurance en Arabie Saoudite : répartition du chiffre d’affaires par branche (2015-2016)
en milliers| Chiffre d’affaires 2015 | Chiffre d’affaires 2016 | Parts 2016 | |||
|---|---|---|---|---|---|
| En SAR(1) | En USD | En SAR(1) | En USD | ||
Aviation | 147 000 | 39 198 | 140 000 | 37 344 | 0,4% |
Energie | 563 000 | 150 124 | 458 000 | 122 167 | 1,2% |
Accidents & Responsabilité Civile | 1 093 000 | 291 448 | 1 050 000 | 280 077 | 2,8% |
Transport | 726 000 | 193 588 | 634 000 | 169 113 | 1,7% |
Epargne & prévoyance | 1 036 000 | 276 249 | 1 051 000 | 280 344 | 2,9% |
Engineering | 1 204 000 | 321 047 | 908 000 | 242 200 | 2,5% |
Incendie et dommage aux biens | 1 962 000 | 523 167 | 1 826 000 | 487 067 | 5,0% |
Automobile | 10 799 000 | 2 879 553 | 12 158 000 | 3 243 025 | 33,0% |
Maladie | 18 967 000 | 5 057 551 | 18 630 000 | 4 969 366 | 50,5% |
Total général | 36 497 000 | 9 731 925 | 36 855 000 | 9 830 703 | 100,0% |
Parts de marché par branche en 2016
 Source: Bourse Arabie Saoudite (Tadawul), L'autorité monétaire de l'Arabie Saoudite (SAMA)
Taux de change SAR/USD au 31/12 | 2015 | 2016 |
0,26665 | 0,26674 |
- Vous devez vous identifier ou créer un compte pour écrire des commentaires
